Data are provided by many contributors through the the WHO Clinical data platform and are not necessarily representative. To become a contributor, please see the terms of use and register here.
Total countries
12
Total cases
2517
Confirmed cases
1032
Total PLWH
925
Women
4.9%
Total deaths
20
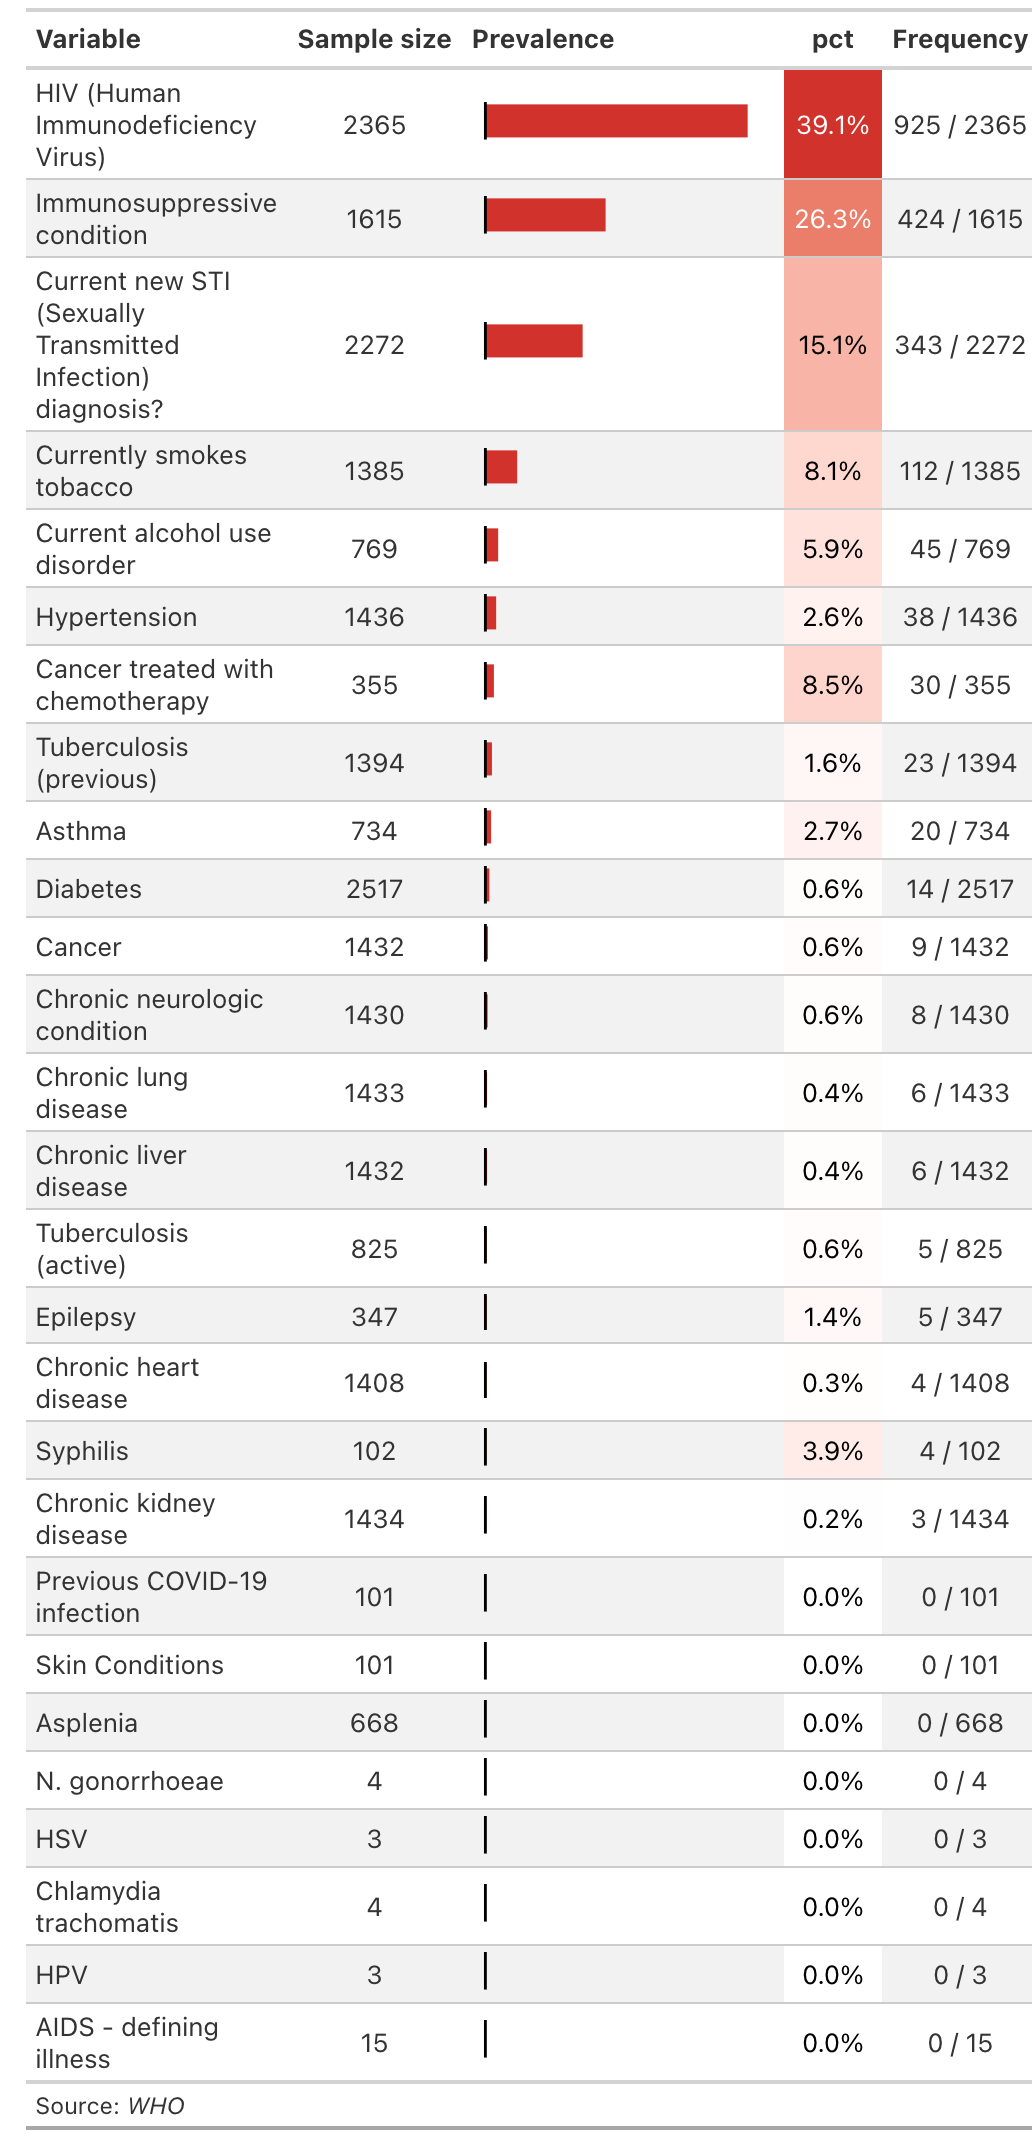
| Variable | Sample size | Prevalence | pct | Frequency |
|---|---|---|---|---|
| HIV (Human Immunodeficiency Virus) | 2365 | 39.1% | 925 / 2365 | |
| Immunosuppressive condition | 1615 | 26.3% | 424 / 1615 | |
| Current new STI (Sexually Transmitted Infection) diagnosis? | 2272 | 15.1% | 343 / 2272 | |
| Currently smokes tobacco | 1385 | 8.1% | 112 / 1385 | |
| Current alcohol use disorder | 769 | 5.9% | 45 / 769 | |
| Hypertension | 1436 | 2.6% | 38 / 1436 | |
| Cancer treated with chemotherapy | 355 | 8.5% | 30 / 355 | |
| Tuberculosis (previous) | 1394 | 1.6% | 23 / 1394 | |
| Asthma | 734 | 2.7% | 20 / 734 | |
| Diabetes | 2517 | 0.6% | 14 / 2517 | |
| Cancer | 1432 | 0.6% | 9 / 1432 | |
| Chronic neurologic condition | 1430 | 0.6% | 8 / 1430 | |
| Chronic lung disease | 1433 | 0.4% | 6 / 1433 | |
| Chronic liver disease | 1432 | 0.4% | 6 / 1432 | |
| Tuberculosis (active) | 825 | 0.6% | 5 / 825 | |
| Epilepsy | 347 | 1.4% | 5 / 347 | |
| Chronic heart disease | 1408 | 0.3% | 4 / 1408 | |
| Syphilis | 102 | 3.9% | 4 / 102 | |
| Chronic kidney disease | 1434 | 0.2% | 3 / 1434 | |
| Previous COVID-19 infection | 101 | 0.0% | 0 / 101 | |
| Skin Conditions | 101 | 0.0% | 0 / 101 | |
| Asplenia | 668 | 0.0% | 0 / 668 | |
| N. gonorrhoeae | 4 | 0.0% | 0 / 4 | |
| HSV | 3 | 0.0% | 0 / 3 | |
| Chlamydia trachomatis | 4 | 0.0% | 0 / 4 | |
| HPV | 3 | 0.0% | 0 / 3 | |
| AIDS - defining illness | 15 | 0.0% | 0 / 15 | |
Source: WHO |
||||
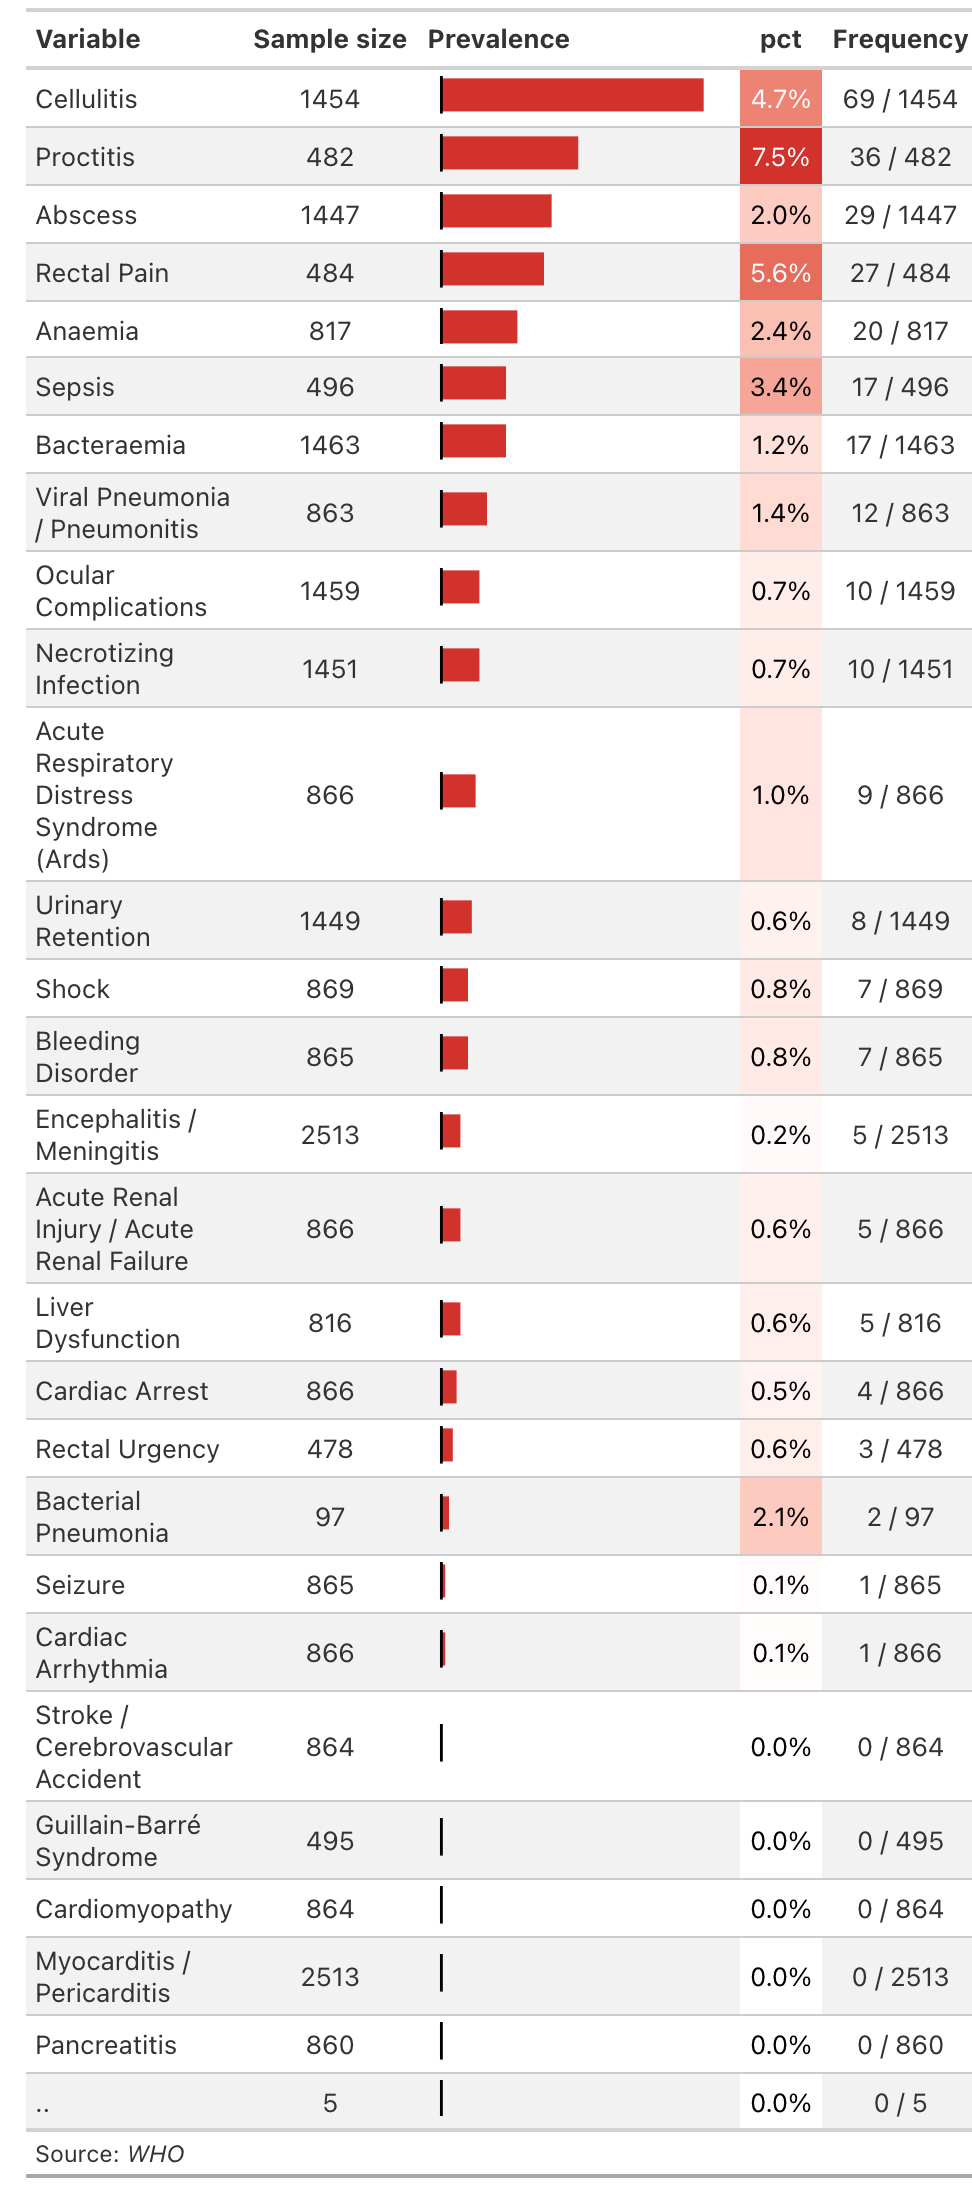
| Variable | Sample size | Prevalence | pct | Frequency |
|---|---|---|---|---|
| Cellulitis | 1454 | 4.7% | 69 / 1454 | |
| Proctitis | 482 | 7.5% | 36 / 482 | |
| Abscess | 1447 | 2.0% | 29 / 1447 | |
| Rectal Pain | 484 | 5.6% | 27 / 484 | |
| Anaemia | 817 | 2.4% | 20 / 817 | |
| Sepsis | 496 | 3.4% | 17 / 496 | |
| Bacteraemia | 1463 | 1.2% | 17 / 1463 | |
| Viral Pneumonia / Pneumonitis | 863 | 1.4% | 12 / 863 | |
| Ocular Complications | 1459 | 0.7% | 10 / 1459 | |
| Necrotizing Infection | 1451 | 0.7% | 10 / 1451 | |
| Acute Respiratory Distress Syndrome (Ards) | 866 | 1.0% | 9 / 866 | |
| Urinary Retention | 1449 | 0.6% | 8 / 1449 | |
| Shock | 869 | 0.8% | 7 / 869 | |
| Bleeding Disorder | 865 | 0.8% | 7 / 865 | |
| Encephalitis / Meningitis | 2513 | 0.2% | 5 / 2513 | |
| Acute Renal Injury / Acute Renal Failure | 866 | 0.6% | 5 / 866 | |
| Liver Dysfunction | 816 | 0.6% | 5 / 816 | |
| Cardiac Arrest | 866 | 0.5% | 4 / 866 | |
| Rectal Urgency | 478 | 0.6% | 3 / 478 | |
| Bacterial Pneumonia | 97 | 2.1% | 2 / 97 | |
| Seizure | 865 | 0.1% | 1 / 865 | |
| Cardiac Arrhythmia | 866 | 0.1% | 1 / 866 | |
| Stroke / Cerebrovascular Accident | 864 | 0.0% | 0 / 864 | |
| Guillain-Barré Syndrome | 495 | 0.0% | 0 / 495 | |
| Cardiomyopathy | 864 | 0.0% | 0 / 864 | |
| Myocarditis / Pericarditis | 2513 | 0.0% | 0 / 2513 | |
| Pancreatitis | 860 | 0.0% | 0 / 860 | |
| .. | 5 | 0.0% | 0 / 5 | |
Source: WHO |
||||
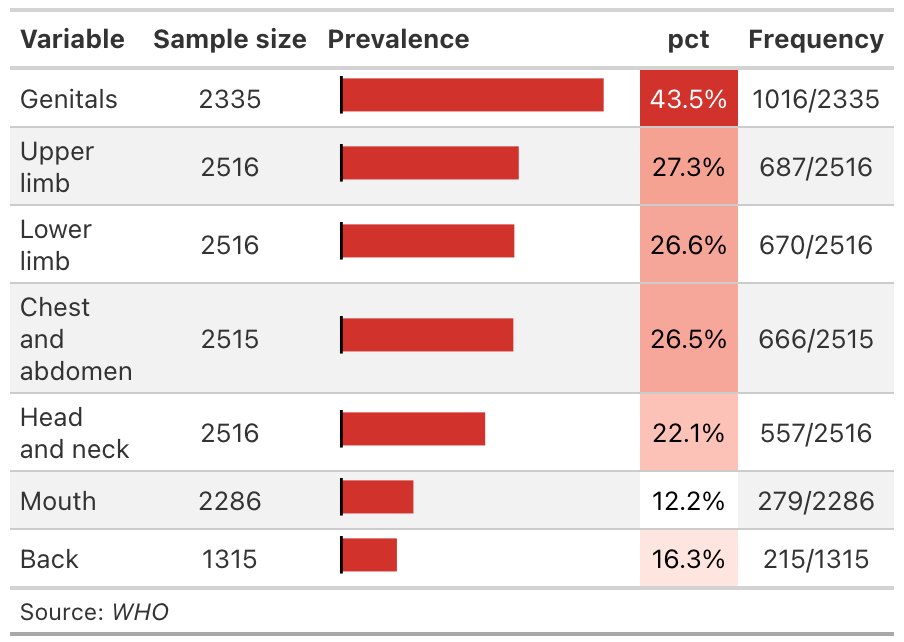
| Variable | Sample size | Prevalence | pct | Frequency |
|---|---|---|---|---|
| Genitals | 2335 | 43.5% | 1016/2335 | |
| Upper limb | 2516 | 27.3% | 687/2516 | |
| Lower limb | 2516 | 26.6% | 670/2516 | |
| Chest and abdomen | 2515 | 26.5% | 666/2515 | |
| Head and neck | 2516 | 22.1% | 557/2516 | |
| Mouth | 2286 | 12.2% | 279/2286 | |
| Back | 1315 | 16.3% | 215/1315 | |
Source: WHO |
||||
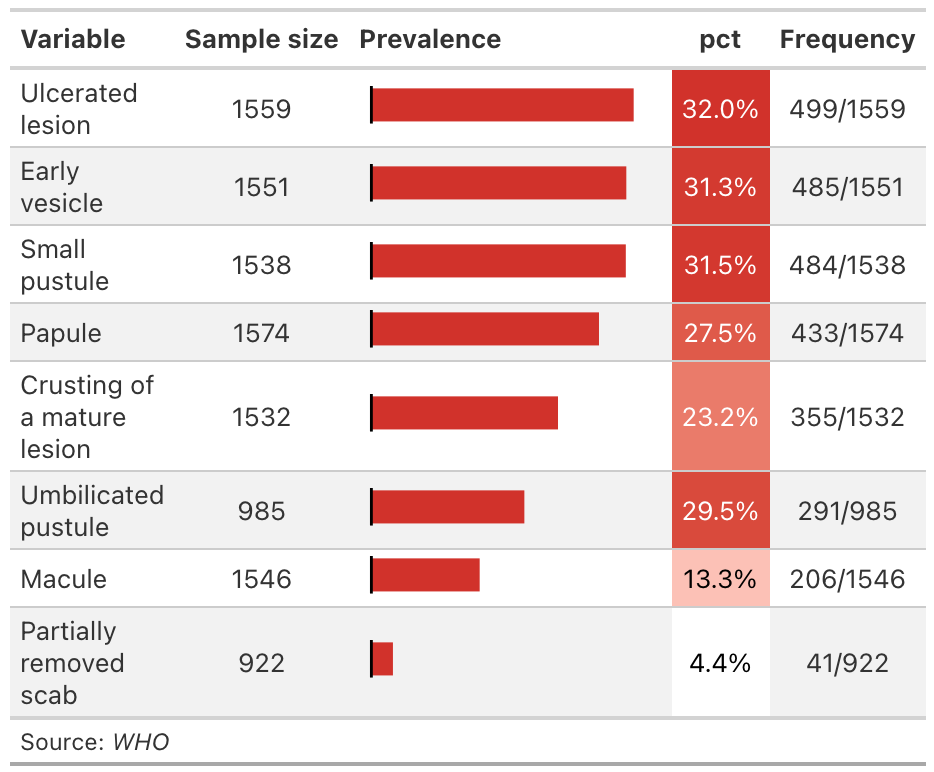
| Variable | Sample size | Prevalence | pct | Frequency |
|---|---|---|---|---|
| Ulcerated lesion | 1559 | 32.0% | 499/1559 | |
| Early vesicle | 1551 | 31.3% | 485/1551 | |
| Small pustule | 1538 | 31.5% | 484/1538 | |
| Papule | 1574 | 27.5% | 433/1574 | |
| Crusting of a mature lesion | 1532 | 23.2% | 355/1532 | |
| Umbilicated pustule | 985 | 29.5% | 291/985 | |
| Macule | 1546 | 13.3% | 206/1546 | |
| Partially removed scab | 922 | 4.4% | 41/922 | |
Source: WHO |
||||
| Variable | Sample size | Prevalence | pct | Frequency |
|---|---|---|---|---|
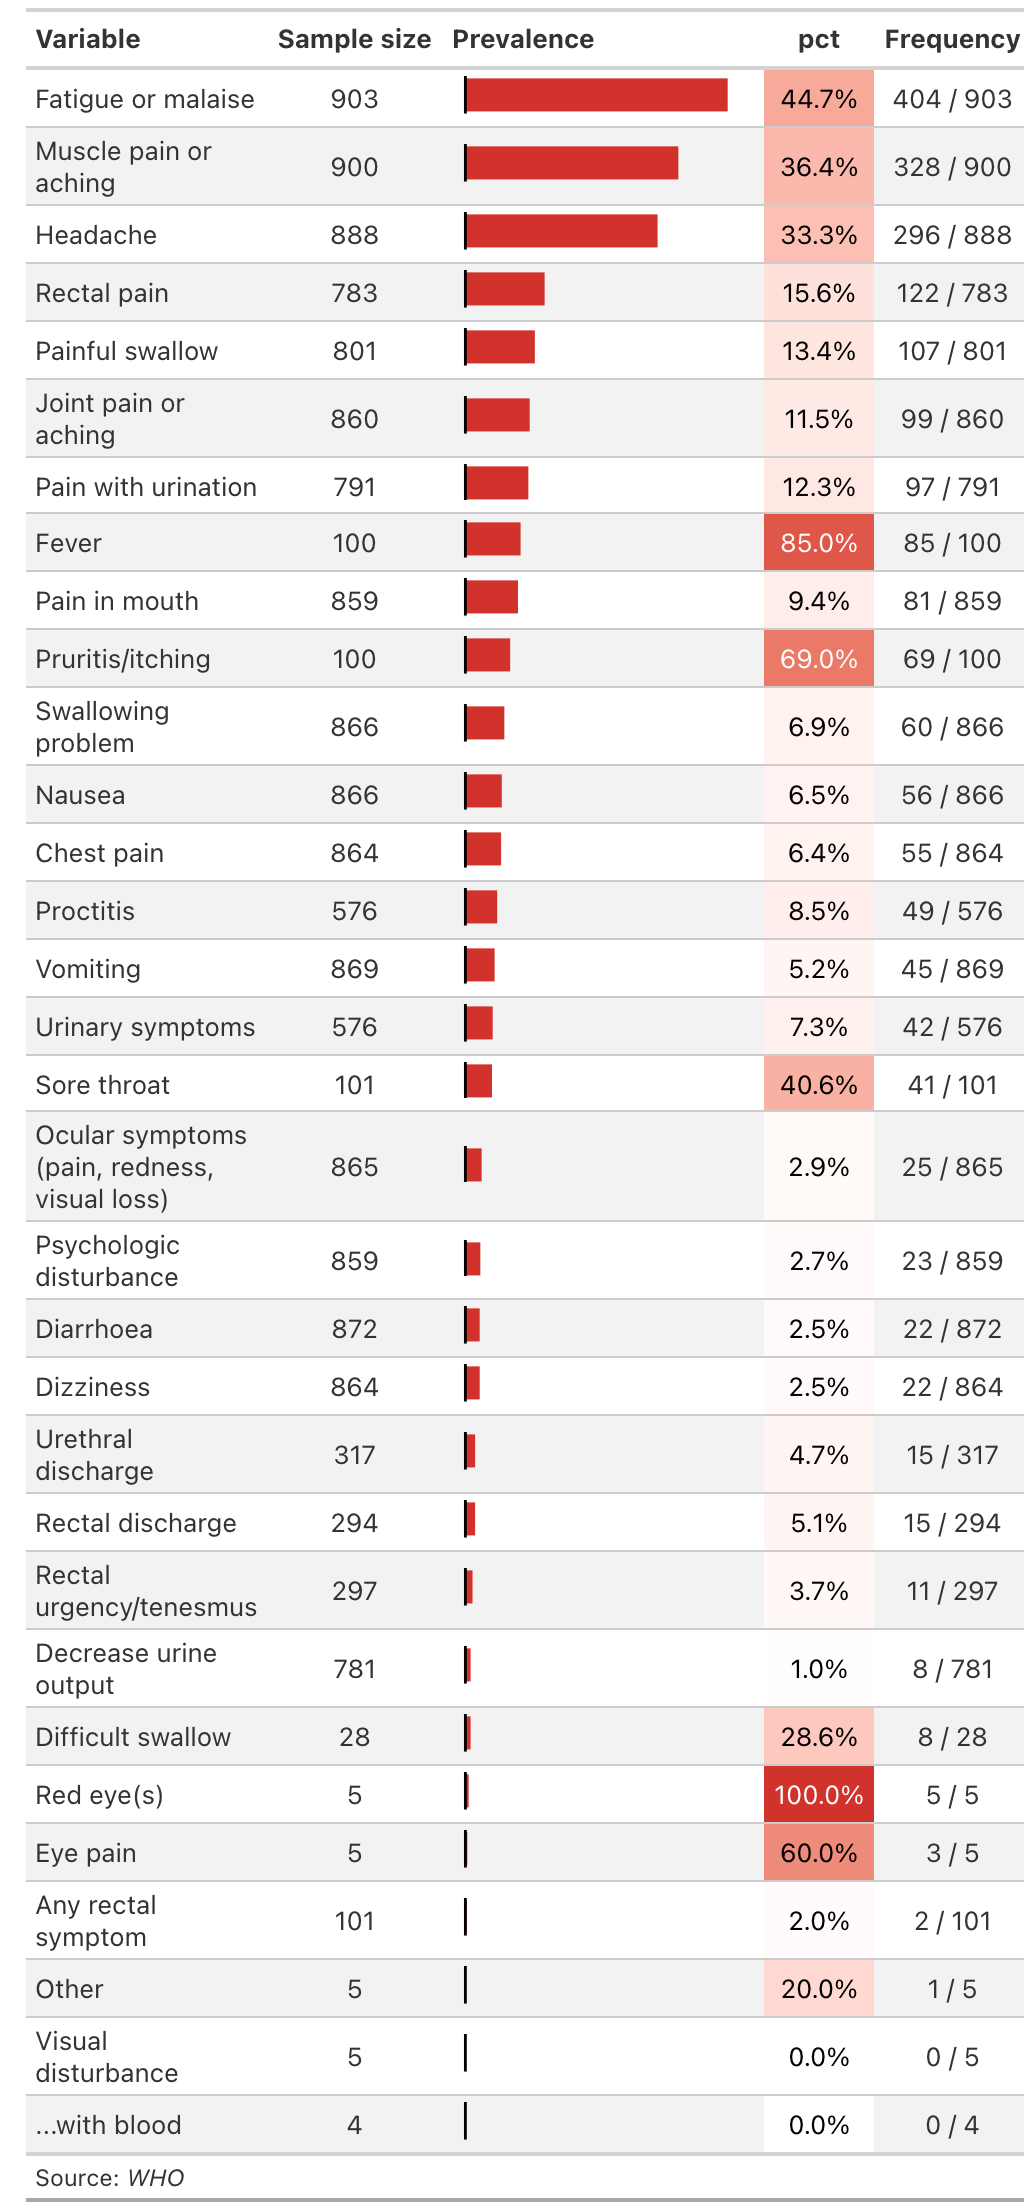
| Fatigue or malaise | 903 | 44.7% | 404 / 903 | |
| Muscle pain or aching | 900 | 36.4% | 328 / 900 | |
| Headache | 888 | 33.3% | 296 / 888 | |
| Rectal pain | 783 | 15.6% | 122 / 783 | |
| Painful swallow | 801 | 13.4% | 107 / 801 | |
| Joint pain or aching | 860 | 11.5% | 99 / 860 | |
| Pain with urination | 791 | 12.3% | 97 / 791 | |
| Fever | 100 | 85.0% | 85 / 100 | |
| Pain in mouth | 859 | 9.4% | 81 / 859 | |
| Pruritis/itching | 100 | 69.0% | 69 / 100 | |
| Swallowing problem | 866 | 6.9% | 60 / 866 | |
| Nausea | 866 | 6.5% | 56 / 866 | |
| Chest pain | 864 | 6.4% | 55 / 864 | |
| Proctitis | 576 | 8.5% | 49 / 576 | |
| Vomiting | 869 | 5.2% | 45 / 869 | |
| Urinary symptoms | 576 | 7.3% | 42 / 576 | |
| Sore throat | 101 | 40.6% | 41 / 101 | |
| Ocular symptoms (pain, redness, visual loss) | 865 | 2.9% | 25 / 865 | |
| Psychologic disturbance | 859 | 2.7% | 23 / 859 | |
| Diarrhoea | 872 | 2.5% | 22 / 872 | |
| Dizziness | 864 | 2.5% | 22 / 864 | |
| Urethral discharge | 317 | 4.7% | 15 / 317 | |
| Rectal discharge | 294 | 5.1% | 15 / 294 | |
| Rectal urgency/tenesmus | 297 | 3.7% | 11 / 297 | |
| Decrease urine output | 781 | 1.0% | 8 / 781 | |
| Difficult swallow | 28 | 28.6% | 8 / 28 | |
| Red eye(s) | 5 | 100.0% | 5 / 5 | |
| Eye pain | 5 | 60.0% | 3 / 5 | |
| Any rectal symptom | 101 | 2.0% | 2 / 101 | |
| Other | 5 | 20.0% | 1 / 5 | |
| Visual disturbance | 5 | 0.0% | 0 / 5 | |
| ...with blood | 4 | 0.0% | 0 / 4 | |
Source: WHO |
||||
| Variable | Sample size | Prevalence | pct | Frequency |
|---|---|---|---|---|
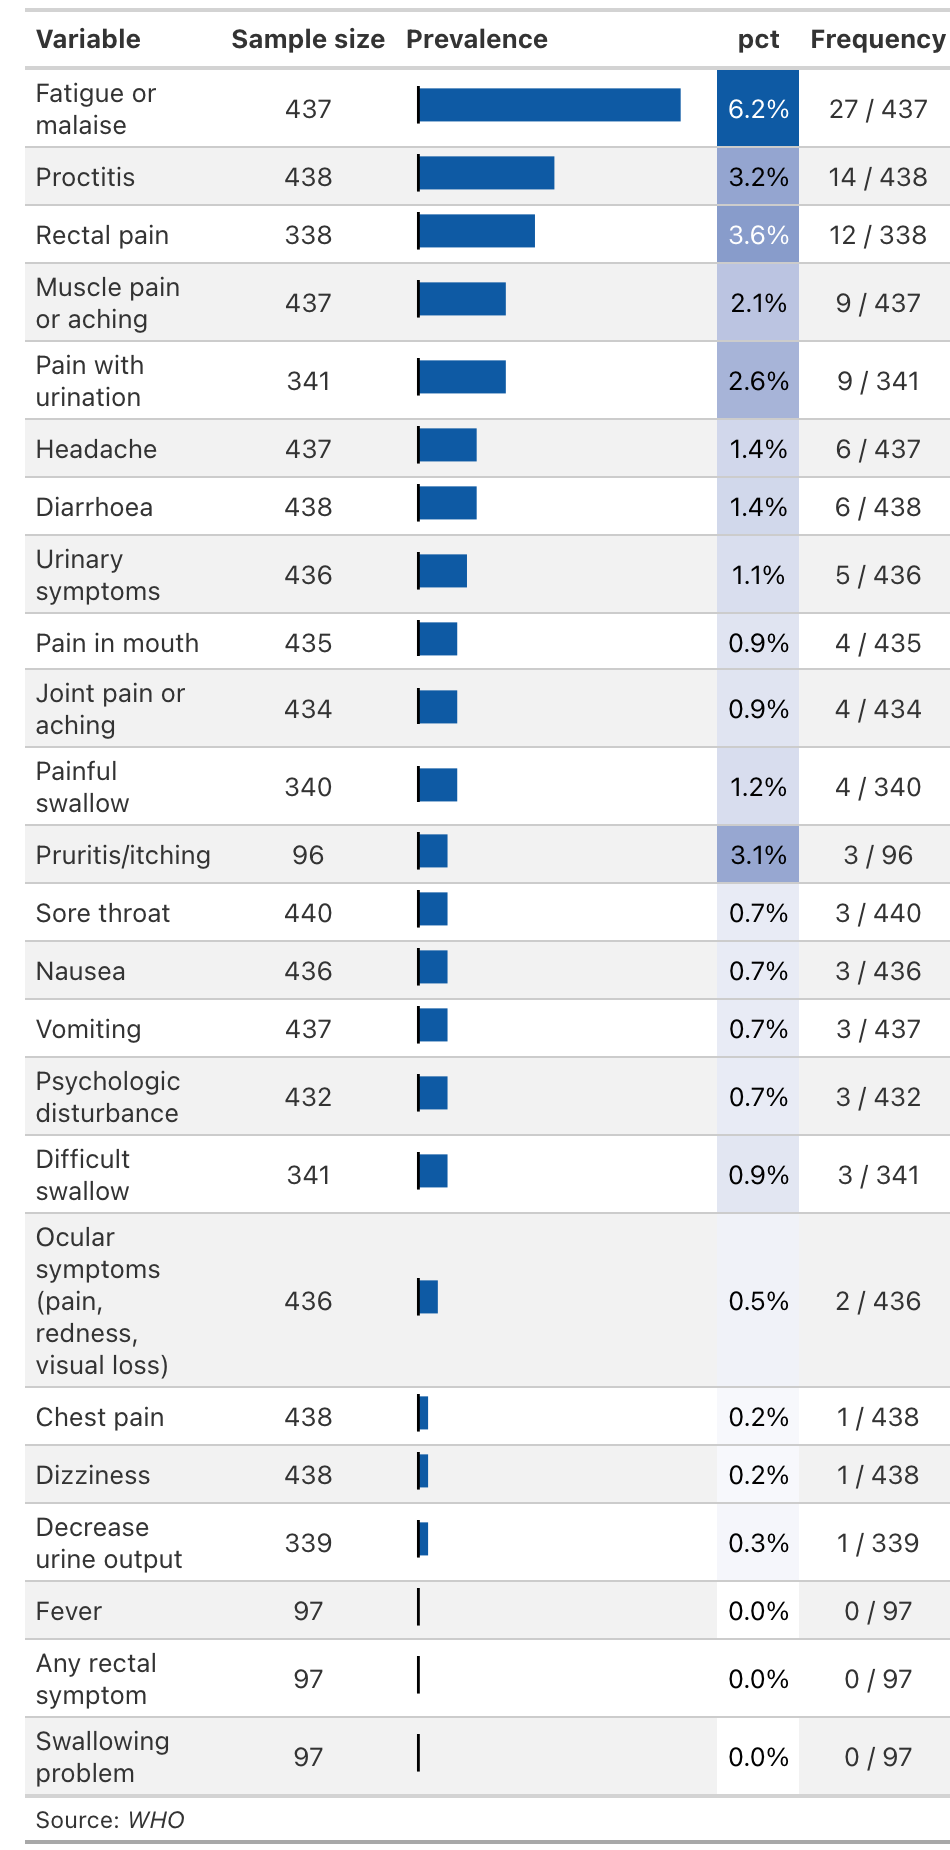
| Fatigue or malaise | 437 | 6.2% | 27 / 437 | |
| Proctitis | 438 | 3.2% | 14 / 438 | |
| Rectal pain | 338 | 3.6% | 12 / 338 | |
| Muscle pain or aching | 437 | 2.1% | 9 / 437 | |
| Pain with urination | 341 | 2.6% | 9 / 341 | |
| Headache | 437 | 1.4% | 6 / 437 | |
| Diarrhoea | 438 | 1.4% | 6 / 438 | |
| Urinary symptoms | 436 | 1.1% | 5 / 436 | |
| Pain in mouth | 435 | 0.9% | 4 / 435 | |
| Joint pain or aching | 434 | 0.9% | 4 / 434 | |
| Painful swallow | 340 | 1.2% | 4 / 340 | |
| Pruritis/itching | 96 | 3.1% | 3 / 96 | |
| Sore throat | 440 | 0.7% | 3 / 440 | |
| Nausea | 436 | 0.7% | 3 / 436 | |
| Vomiting | 437 | 0.7% | 3 / 437 | |
| Psychologic disturbance | 432 | 0.7% | 3 / 432 | |
| Difficult swallow | 341 | 0.9% | 3 / 341 | |
| Ocular symptoms (pain, redness, visual loss) | 436 | 0.5% | 2 / 436 | |
| Chest pain | 438 | 0.2% | 1 / 438 | |
| Dizziness | 438 | 0.2% | 1 / 438 | |
| Decrease urine output | 339 | 0.3% | 1 / 339 | |
| Fever | 97 | 0.0% | 0 / 97 | |
| Any rectal symptom | 97 | 0.0% | 0 / 97 | |
| Swallowing problem | 97 | 0.0% | 0 / 97 | |
Source: WHO |
||||
| Variable | Person with HIV |
Person without HIV |
Unknown |
p-value 1 |
|---|---|---|---|---|
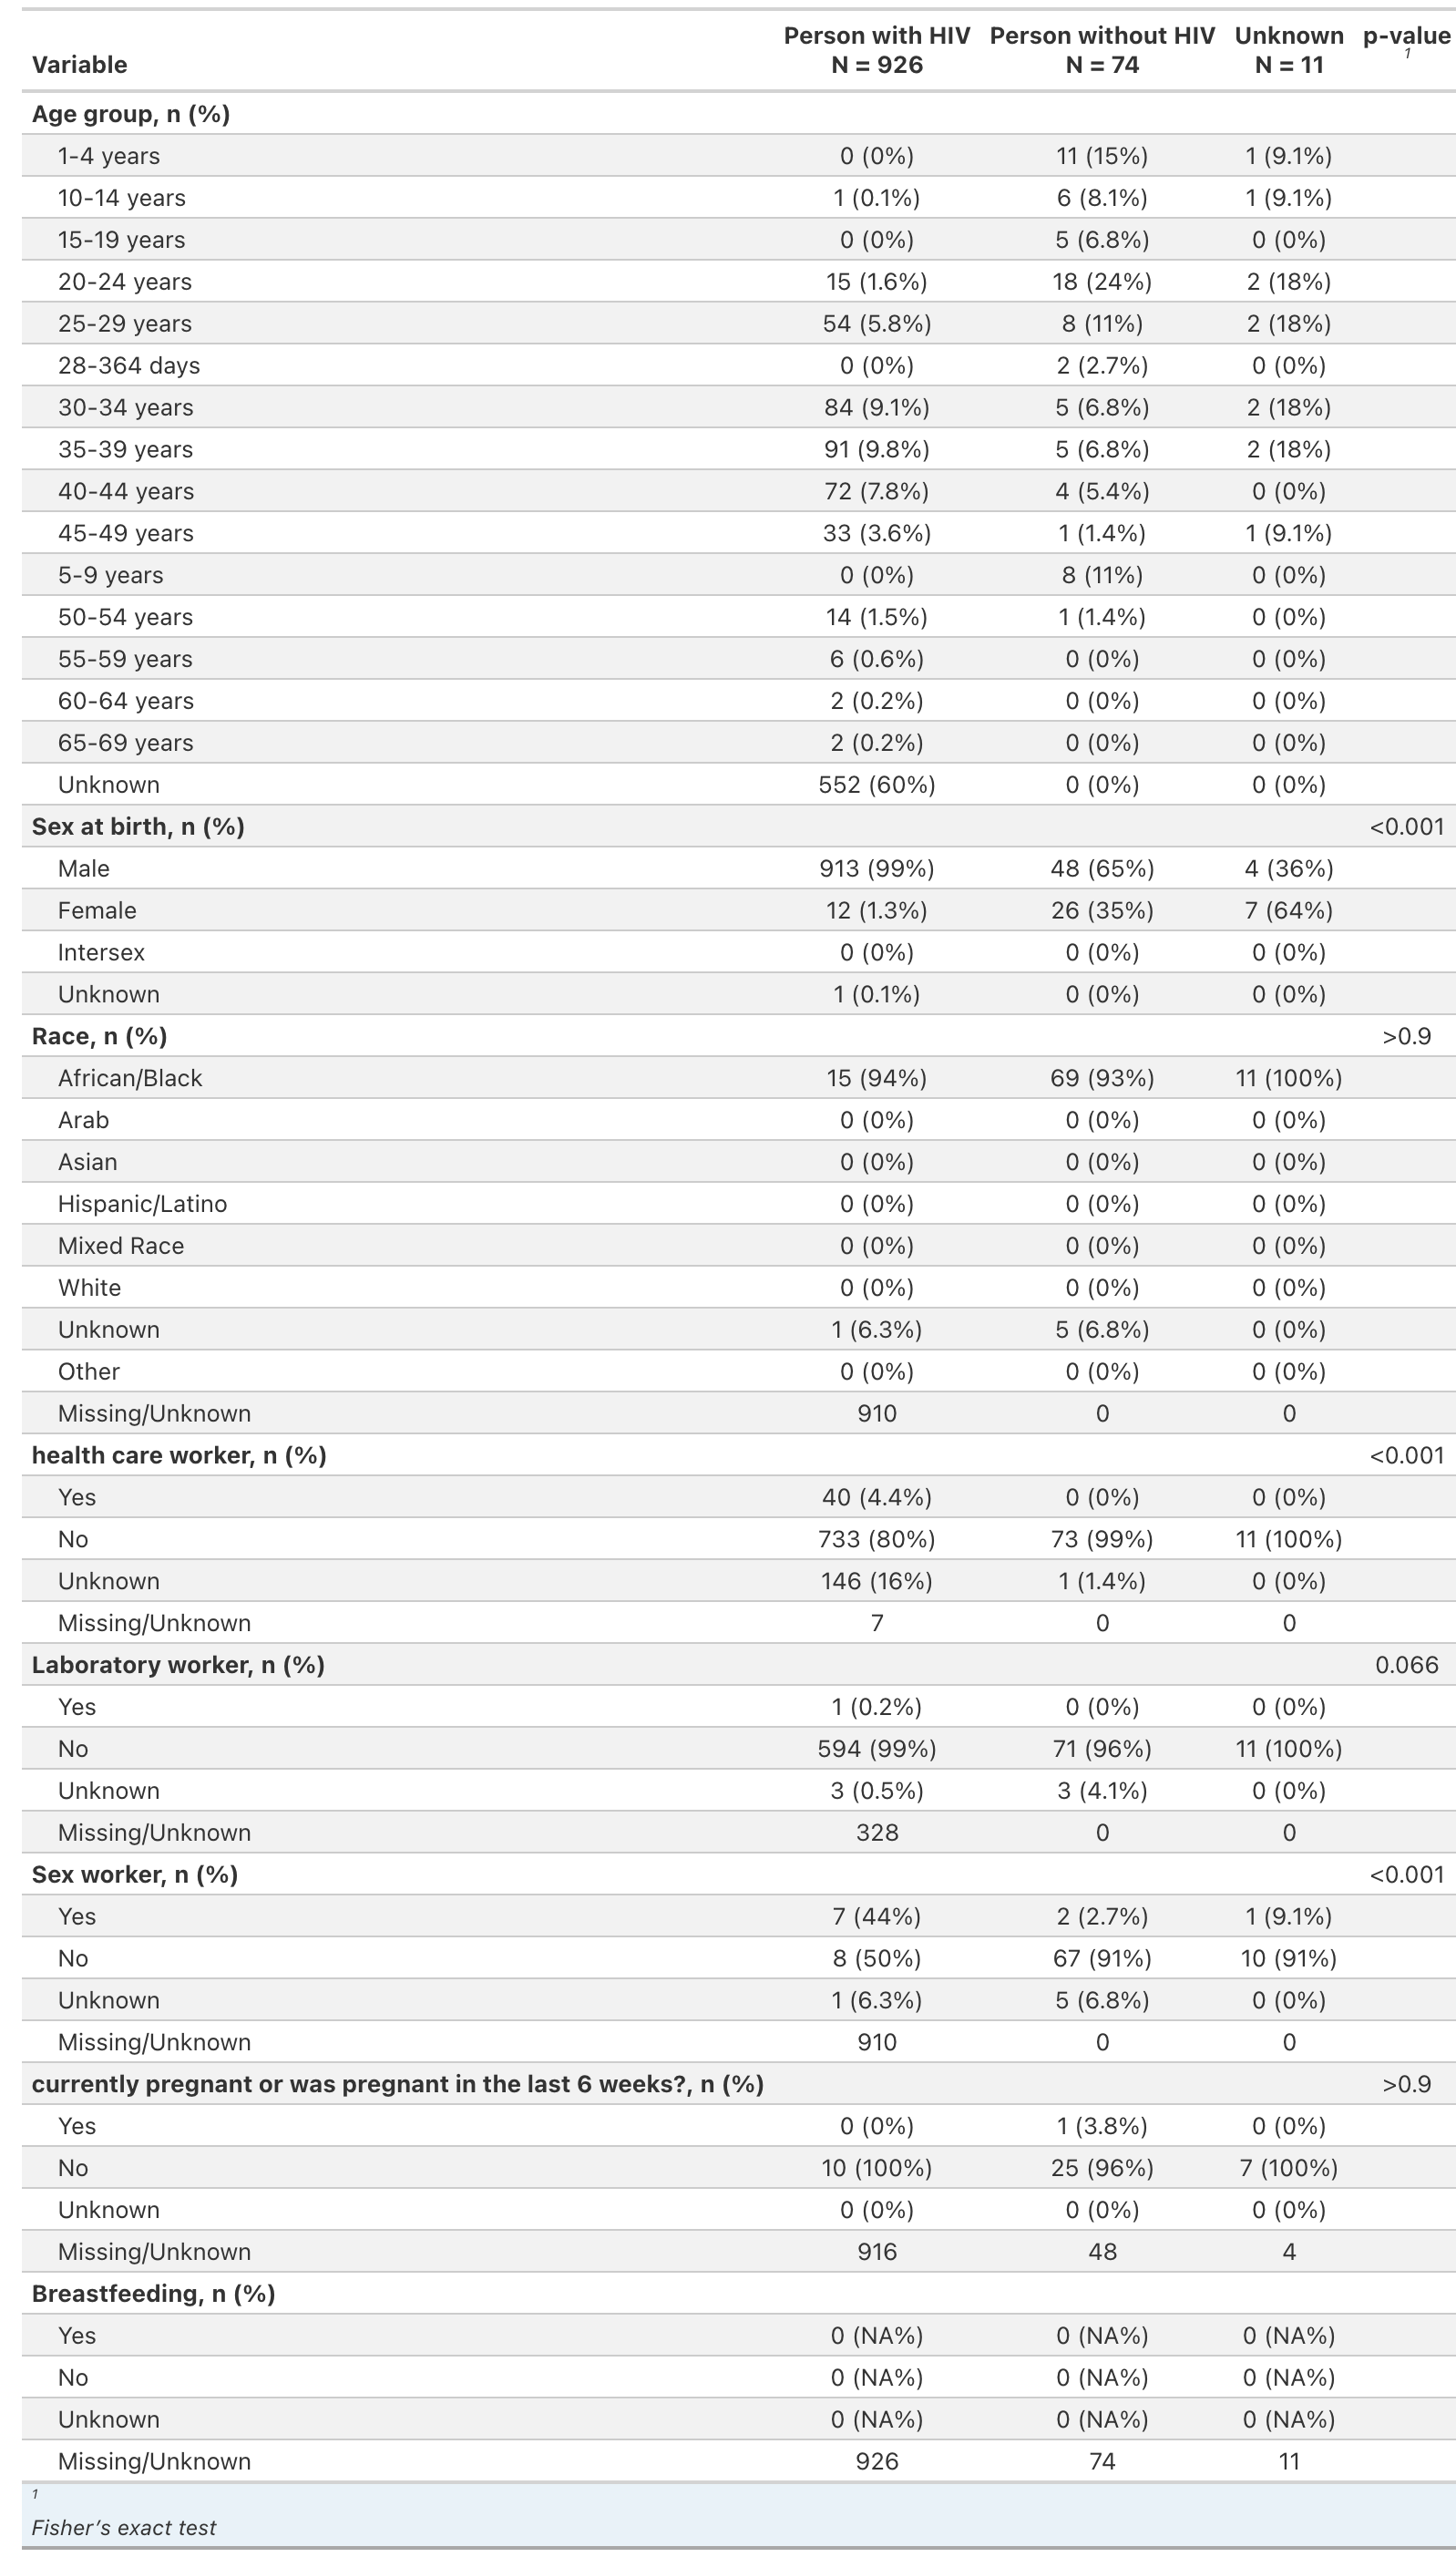
| Age group, n (%) | ||||
| 1-4 years | 0 (0%) | 11 (15%) | 1 (9.1%) | |
| 10-14 years | 1 (0.1%) | 6 (8.1%) | 1 (9.1%) | |
| 15-19 years | 0 (0%) | 5 (6.8%) | 0 (0%) | |
| 20-24 years | 15 (1.6%) | 18 (24%) | 2 (18%) | |
| 25-29 years | 54 (5.8%) | 8 (11%) | 2 (18%) | |
| 28-364 days | 0 (0%) | 2 (2.7%) | 0 (0%) | |
| 30-34 years | 84 (9.1%) | 5 (6.8%) | 2 (18%) | |
| 35-39 years | 91 (9.8%) | 5 (6.8%) | 2 (18%) | |
| 40-44 years | 72 (7.8%) | 4 (5.4%) | 0 (0%) | |
| 45-49 years | 33 (3.6%) | 1 (1.4%) | 1 (9.1%) | |
| 5-9 years | 0 (0%) | 8 (11%) | 0 (0%) | |
| 50-54 years | 14 (1.5%) | 1 (1.4%) | 0 (0%) | |
| 55-59 years | 6 (0.6%) | 0 (0%) | 0 (0%) | |
| 60-64 years | 2 (0.2%) | 0 (0%) | 0 (0%) | |
| 65-69 years | 2 (0.2%) | 0 (0%) | 0 (0%) | |
| Unknown | 552 (60%) | 0 (0%) | 0 (0%) | |
| Sex at birth, n (%) | <0.001 | |||
| Male | 913 (99%) | 48 (65%) | 4 (36%) | |
| Female | 12 (1.3%) | 26 (35%) | 7 (64%) | |
| Intersex | 0 (0%) | 0 (0%) | 0 (0%) | |
| Unknown | 1 (0.1%) | 0 (0%) | 0 (0%) | |
| Race, n (%) | >0.9 | |||
| African/Black | 15 (94%) | 69 (93%) | 11 (100%) | |
| Arab | 0 (0%) | 0 (0%) | 0 (0%) | |
| Asian | 0 (0%) | 0 (0%) | 0 (0%) | |
| Hispanic/Latino | 0 (0%) | 0 (0%) | 0 (0%) | |
| Mixed Race | 0 (0%) | 0 (0%) | 0 (0%) | |
| White | 0 (0%) | 0 (0%) | 0 (0%) | |
| Unknown | 1 (6.3%) | 5 (6.8%) | 0 (0%) | |
| Other | 0 (0%) | 0 (0%) | 0 (0%) | |
| Missing/Unknown | 910 | 0 | 0 | |
| health care worker, n (%) | <0.001 | |||
| Yes | 40 (4.4%) | 0 (0%) | 0 (0%) | |
| No | 733 (80%) | 73 (99%) | 11 (100%) | |
| Unknown | 146 (16%) | 1 (1.4%) | 0 (0%) | |
| Missing/Unknown | 7 | 0 | 0 | |
| Laboratory worker, n (%) | 0.066 | |||
| Yes | 1 (0.2%) | 0 (0%) | 0 (0%) | |
| No | 594 (99%) | 71 (96%) | 11 (100%) | |
| Unknown | 3 (0.5%) | 3 (4.1%) | 0 (0%) | |
| Missing/Unknown | 328 | 0 | 0 | |
| Sex worker, n (%) | <0.001 | |||
| Yes | 7 (44%) | 2 (2.7%) | 1 (9.1%) | |
| No | 8 (50%) | 67 (91%) | 10 (91%) | |
| Unknown | 1 (6.3%) | 5 (6.8%) | 0 (0%) | |
| Missing/Unknown | 910 | 0 | 0 | |
| currently pregnant or was pregnant in the last 6 weeks?, n (%) | >0.9 | |||
| Yes | 0 (0%) | 1 (3.8%) | 0 (0%) | |
| No | 10 (100%) | 25 (96%) | 7 (100%) | |
| Unknown | 0 (0%) | 0 (0%) | 0 (0%) | |
| Missing/Unknown | 916 | 48 | 4 | |
| Breastfeeding, n (%) | ||||
| Yes | 0 (NA%) | 0 (NA%) | 0 (NA%) | |
| No | 0 (NA%) | 0 (NA%) | 0 (NA%) | |
| Unknown | 0 (NA%) | 0 (NA%) | 0 (NA%) | |
| Missing/Unknown | 926 | 74 | 11 | |
| 1
Fisher’s exact test |
||||
| Variable | Person with HIV |
Person without HIV |
Unknown |
p-value 1 |
|---|---|---|---|---|
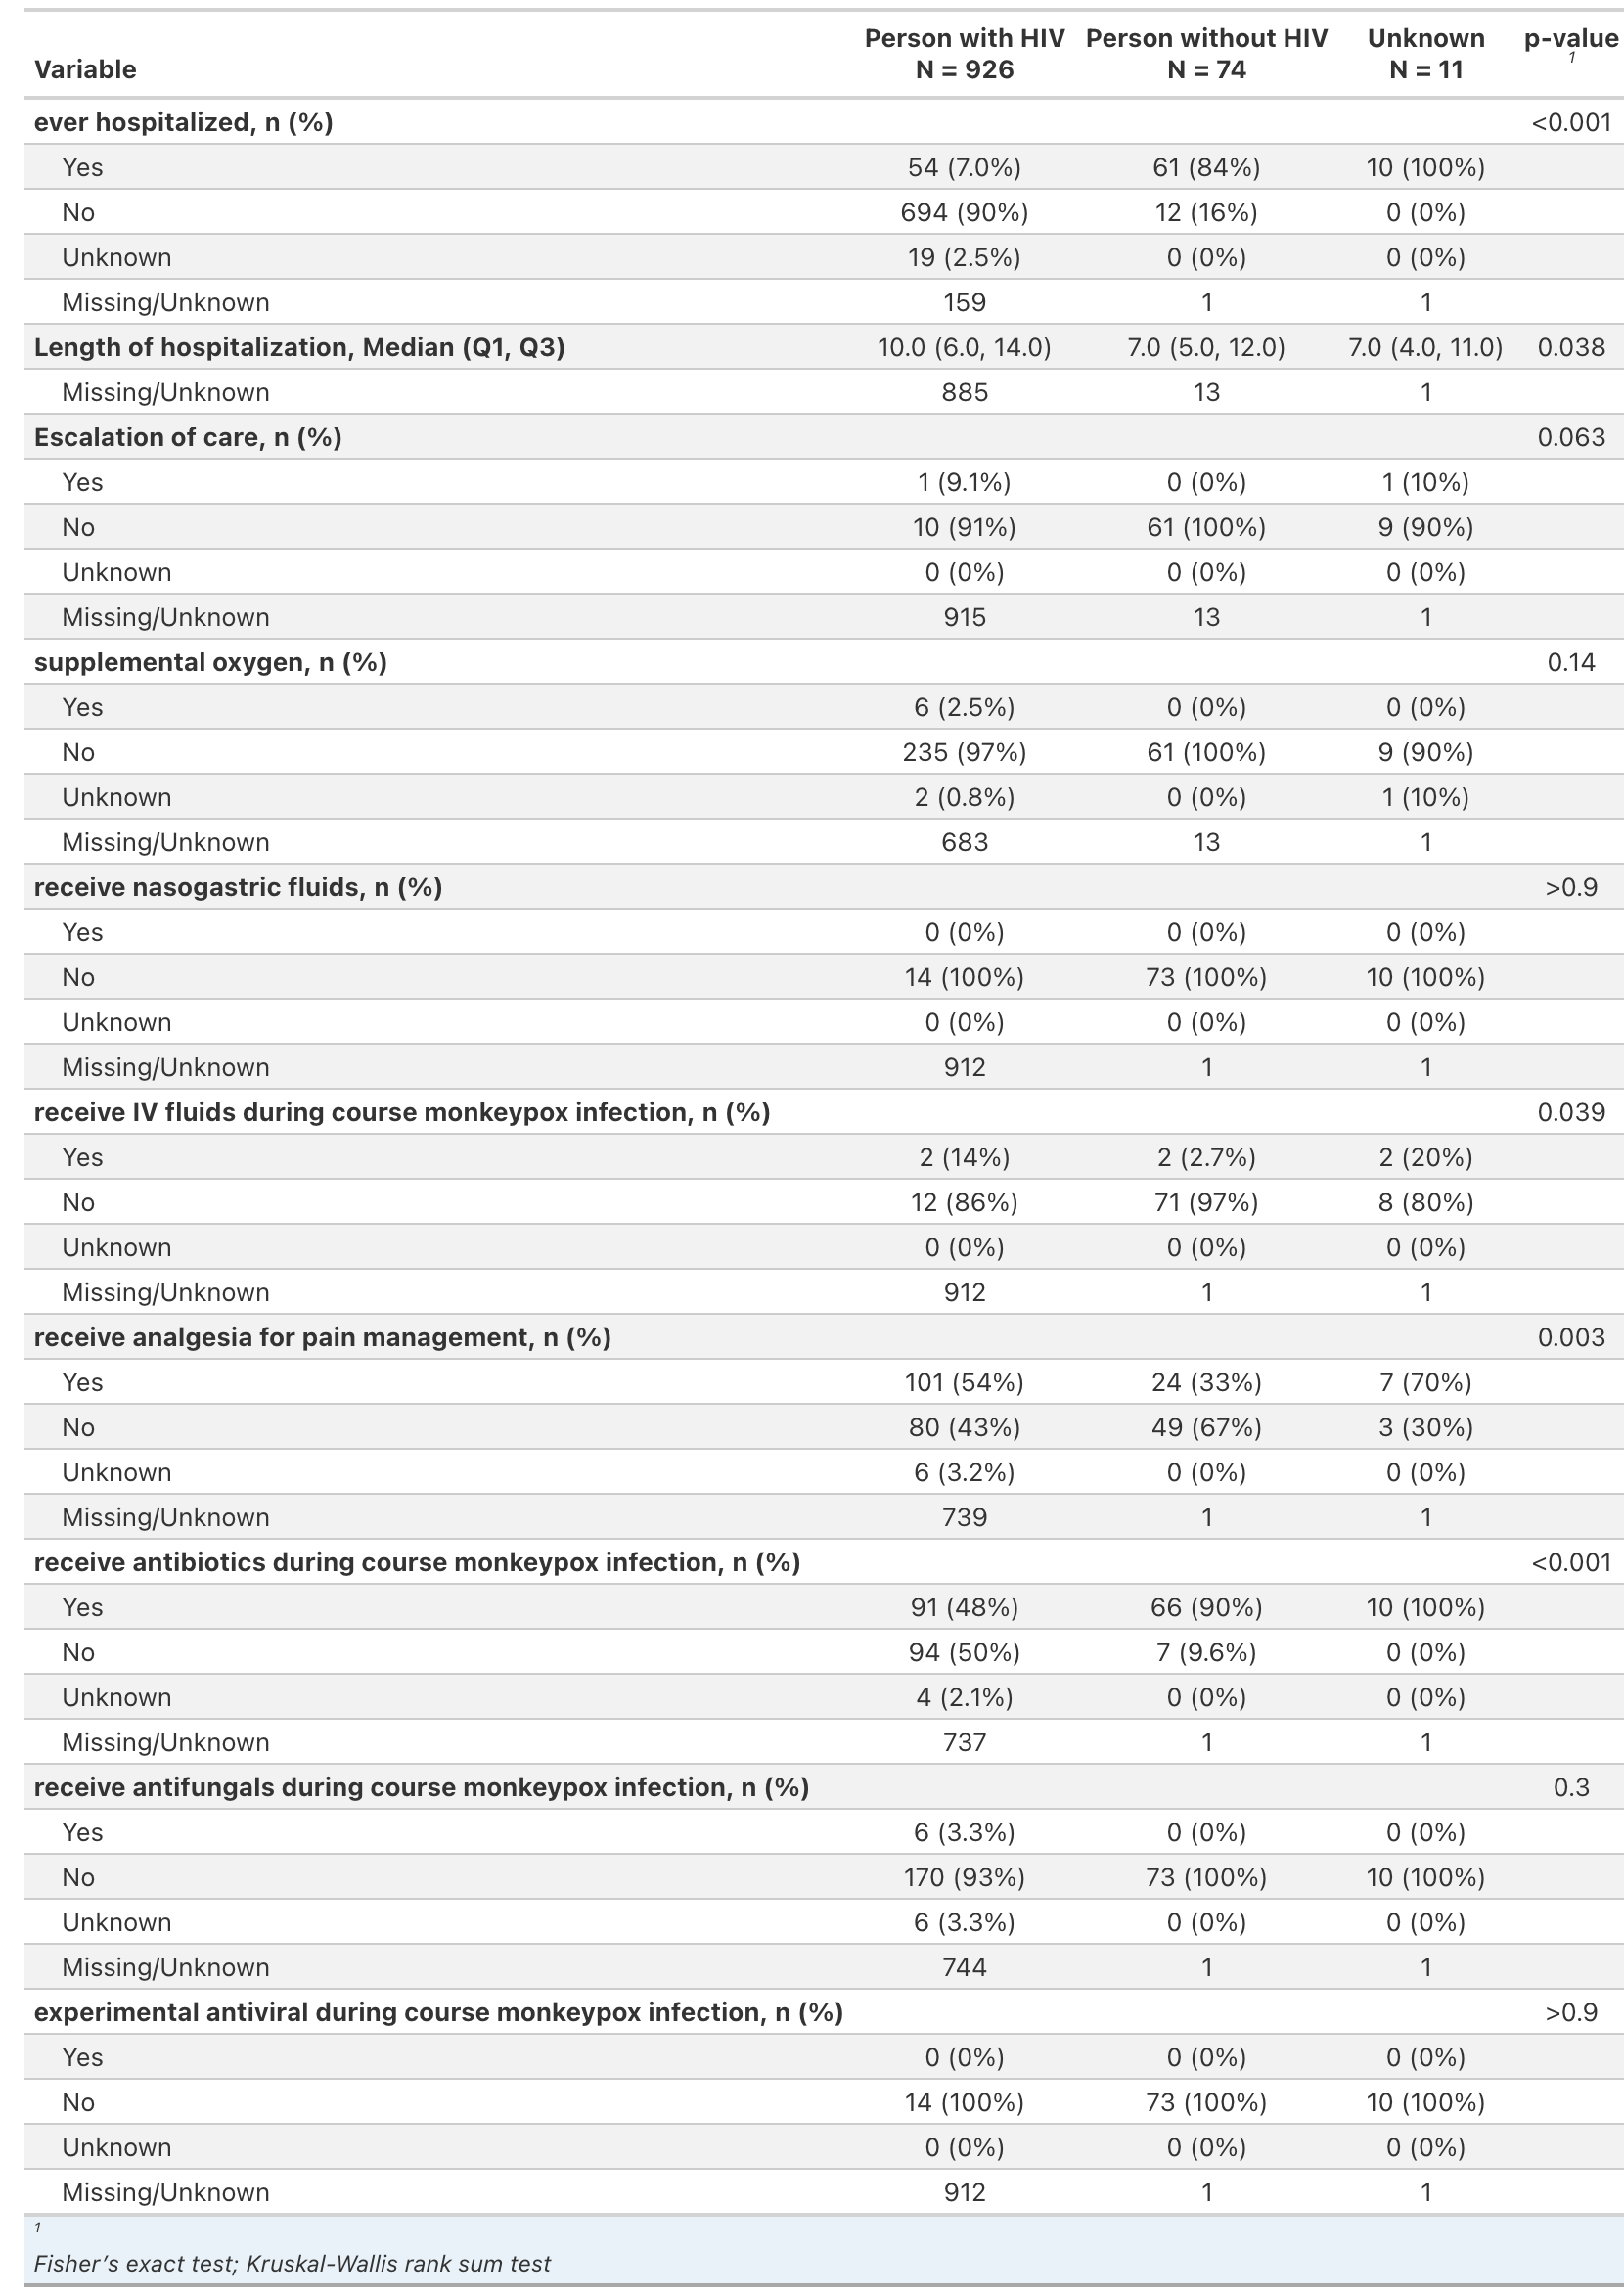
| ever hospitalized, n (%) | <0.001 | |||
| Yes | 54 (7.0%) | 61 (84%) | 10 (100%) | |
| No | 694 (90%) | 12 (16%) | 0 (0%) | |
| Unknown | 19 (2.5%) | 0 (0%) | 0 (0%) | |
| Missing/Unknown | 159 | 1 | 1 | |
| Length of hospitalization, Median (Q1, Q3) | 10.0 (6.0, 14.0) | 7.0 (5.0, 12.0) | 7.0 (4.0, 11.0) | 0.038 |
| Missing/Unknown | 885 | 13 | 1 | |
| Escalation of care, n (%) | 0.063 | |||
| Yes | 1 (9.1%) | 0 (0%) | 1 (10%) | |
| No | 10 (91%) | 61 (100%) | 9 (90%) | |
| Unknown | 0 (0%) | 0 (0%) | 0 (0%) | |
| Missing/Unknown | 915 | 13 | 1 | |
| supplemental oxygen, n (%) | 0.14 | |||
| Yes | 6 (2.5%) | 0 (0%) | 0 (0%) | |
| No | 235 (97%) | 61 (100%) | 9 (90%) | |
| Unknown | 2 (0.8%) | 0 (0%) | 1 (10%) | |
| Missing/Unknown | 683 | 13 | 1 | |
| receive nasogastric fluids, n (%) | >0.9 | |||
| Yes | 0 (0%) | 0 (0%) | 0 (0%) | |
| No | 14 (100%) | 73 (100%) | 10 (100%) | |
| Unknown | 0 (0%) | 0 (0%) | 0 (0%) | |
| Missing/Unknown | 912 | 1 | 1 | |
| receive IV fluids during course monkeypox infection, n (%) | 0.039 | |||
| Yes | 2 (14%) | 2 (2.7%) | 2 (20%) | |
| No | 12 (86%) | 71 (97%) | 8 (80%) | |
| Unknown | 0 (0%) | 0 (0%) | 0 (0%) | |
| Missing/Unknown | 912 | 1 | 1 | |
| receive analgesia for pain management, n (%) | 0.003 | |||
| Yes | 101 (54%) | 24 (33%) | 7 (70%) | |
| No | 80 (43%) | 49 (67%) | 3 (30%) | |
| Unknown | 6 (3.2%) | 0 (0%) | 0 (0%) | |
| Missing/Unknown | 739 | 1 | 1 | |
| receive antibiotics during course monkeypox infection, n (%) | <0.001 | |||
| Yes | 91 (48%) | 66 (90%) | 10 (100%) | |
| No | 94 (50%) | 7 (9.6%) | 0 (0%) | |
| Unknown | 4 (2.1%) | 0 (0%) | 0 (0%) | |
| Missing/Unknown | 737 | 1 | 1 | |
| receive antifungals during course monkeypox infection, n (%) | 0.3 | |||
| Yes | 6 (3.3%) | 0 (0%) | 0 (0%) | |
| No | 170 (93%) | 73 (100%) | 10 (100%) | |
| Unknown | 6 (3.3%) | 0 (0%) | 0 (0%) | |
| Missing/Unknown | 744 | 1 | 1 | |
| experimental antiviral during course monkeypox infection, n (%) | >0.9 | |||
| Yes | 0 (0%) | 0 (0%) | 0 (0%) | |
| No | 14 (100%) | 73 (100%) | 10 (100%) | |
| Unknown | 0 (0%) | 0 (0%) | 0 (0%) | |
| Missing/Unknown | 912 | 1 | 1 | |
| 1
Fisher’s exact test; Kruskal-Wallis rank sum test |
||||
| Variable | Person with HIV |
Person without HIV |
Unknown |
p-value 1 |
|---|---|---|---|---|
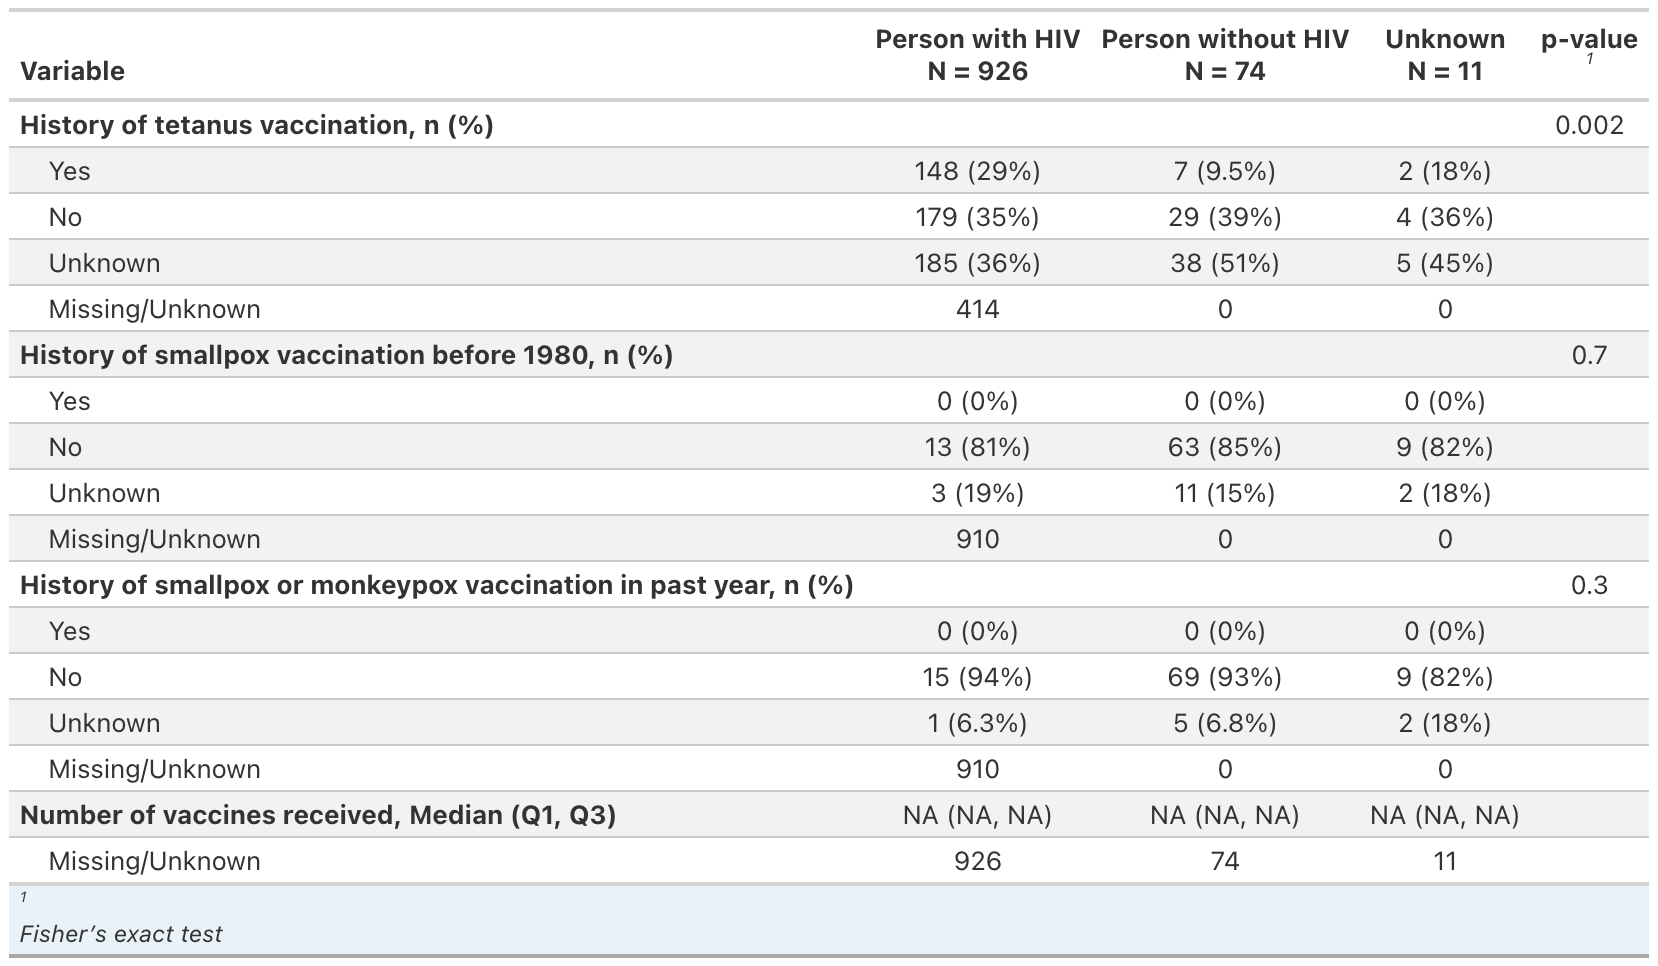
| History of tetanus vaccination, n (%) | 0.002 | |||
| Yes | 148 (29%) | 7 (9.5%) | 2 (18%) | |
| No | 179 (35%) | 29 (39%) | 4 (36%) | |
| Unknown | 185 (36%) | 38 (51%) | 5 (45%) | |
| Missing/Unknown | 414 | 0 | 0 | |
| History of smallpox vaccination before 1980, n (%) | 0.7 | |||
| Yes | 0 (0%) | 0 (0%) | 0 (0%) | |
| No | 13 (81%) | 63 (85%) | 9 (82%) | |
| Unknown | 3 (19%) | 11 (15%) | 2 (18%) | |
| Missing/Unknown | 910 | 0 | 0 | |
| History of smallpox or monkeypox vaccination in past year, n (%) | 0.3 | |||
| Yes | 0 (0%) | 0 (0%) | 0 (0%) | |
| No | 15 (94%) | 69 (93%) | 9 (82%) | |
| Unknown | 1 (6.3%) | 5 (6.8%) | 2 (18%) | |
| Missing/Unknown | 910 | 0 | 0 | |
| Number of vaccines received, Median (Q1, Q3) | NA (NA, NA) | NA (NA, NA) | NA (NA, NA) | |
| Missing/Unknown | 926 | 74 | 11 | |
| 1
Fisher’s exact test |
||||
| Variable | Person with HIV |
Person without HIV |
Unknown |
p-value 1 |
|---|---|---|---|---|
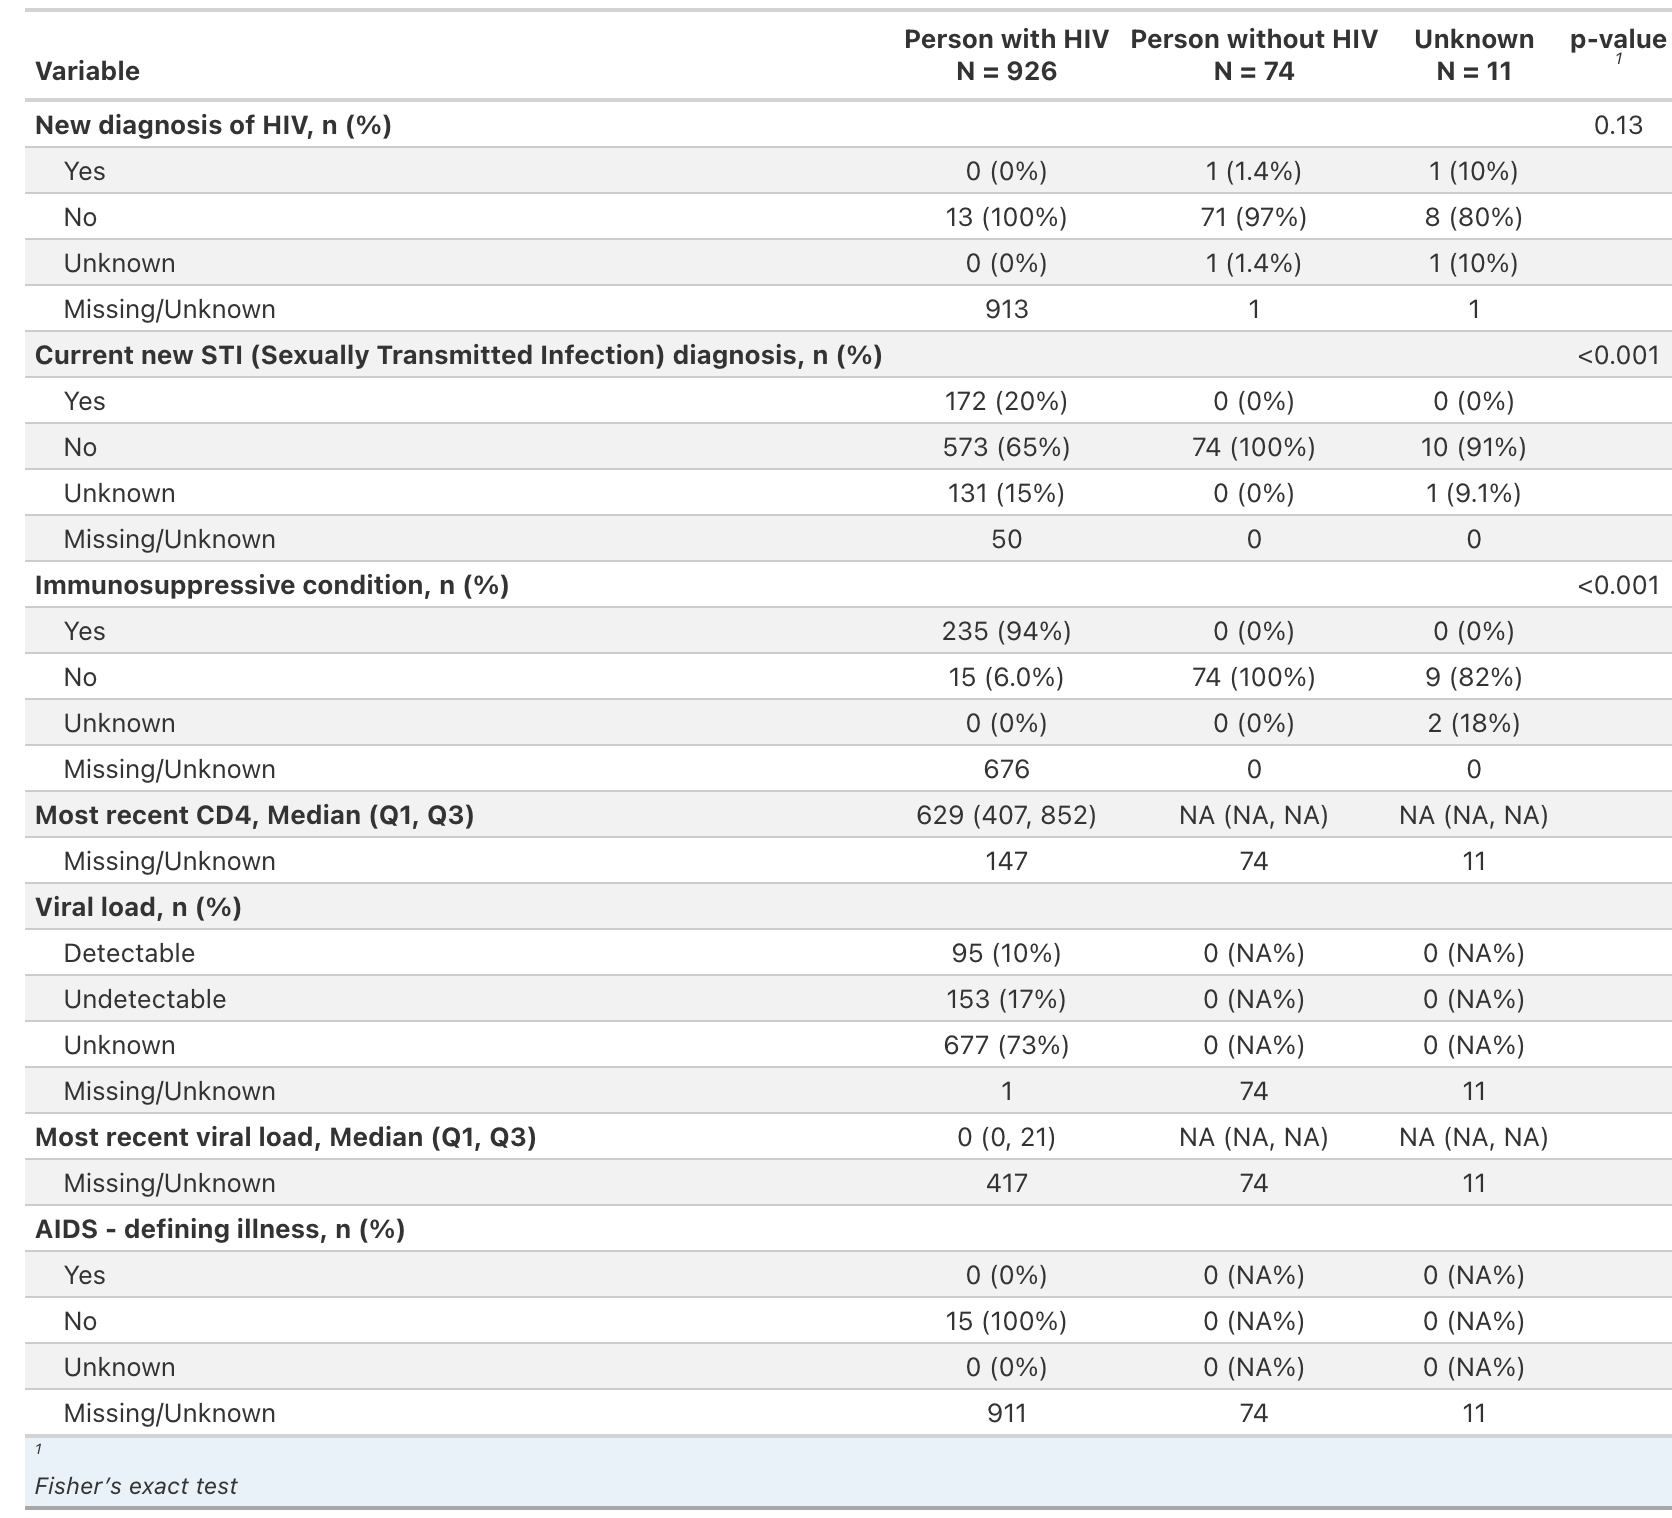
| New diagnosis of HIV, n (%) | 0.13 | |||
| Yes | 0 (0%) | 1 (1.4%) | 1 (10%) | |
| No | 13 (100%) | 71 (97%) | 8 (80%) | |
| Unknown | 0 (0%) | 1 (1.4%) | 1 (10%) | |
| Missing/Unknown | 913 | 1 | 1 | |
| Current new STI (Sexually Transmitted Infection) diagnosis, n (%) | <0.001 | |||
| Yes | 172 (20%) | 0 (0%) | 0 (0%) | |
| No | 573 (65%) | 74 (100%) | 10 (91%) | |
| Unknown | 131 (15%) | 0 (0%) | 1 (9.1%) | |
| Missing/Unknown | 50 | 0 | 0 | |
| Immunosuppressive condition, n (%) | <0.001 | |||
| Yes | 235 (94%) | 0 (0%) | 0 (0%) | |
| No | 15 (6.0%) | 74 (100%) | 9 (82%) | |
| Unknown | 0 (0%) | 0 (0%) | 2 (18%) | |
| Missing/Unknown | 676 | 0 | 0 | |
| Most recent CD4, Median (Q1, Q3) | 629 (407, 852) | NA (NA, NA) | NA (NA, NA) | |
| Missing/Unknown | 147 | 74 | 11 | |
| Viral load, n (%) | ||||
| Detectable | 95 (10%) | 0 (NA%) | 0 (NA%) | |
| Undetectable | 153 (17%) | 0 (NA%) | 0 (NA%) | |
| Unknown | 677 (73%) | 0 (NA%) | 0 (NA%) | |
| Missing/Unknown | 1 | 74 | 11 | |
| Most recent viral load, Median (Q1, Q3) | 0 (0, 21) | NA (NA, NA) | NA (NA, NA) | |
| Missing/Unknown | 417 | 74 | 11 | |
| AIDS - defining illness, n (%) | ||||
| Yes | 0 (0%) | 0 (NA%) | 0 (NA%) | |
| No | 15 (100%) | 0 (NA%) | 0 (NA%) | |
| Unknown | 0 (0%) | 0 (NA%) | 0 (NA%) | |
| Missing/Unknown | 911 | 74 | 11 | |
| 1
Fisher’s exact test |
||||
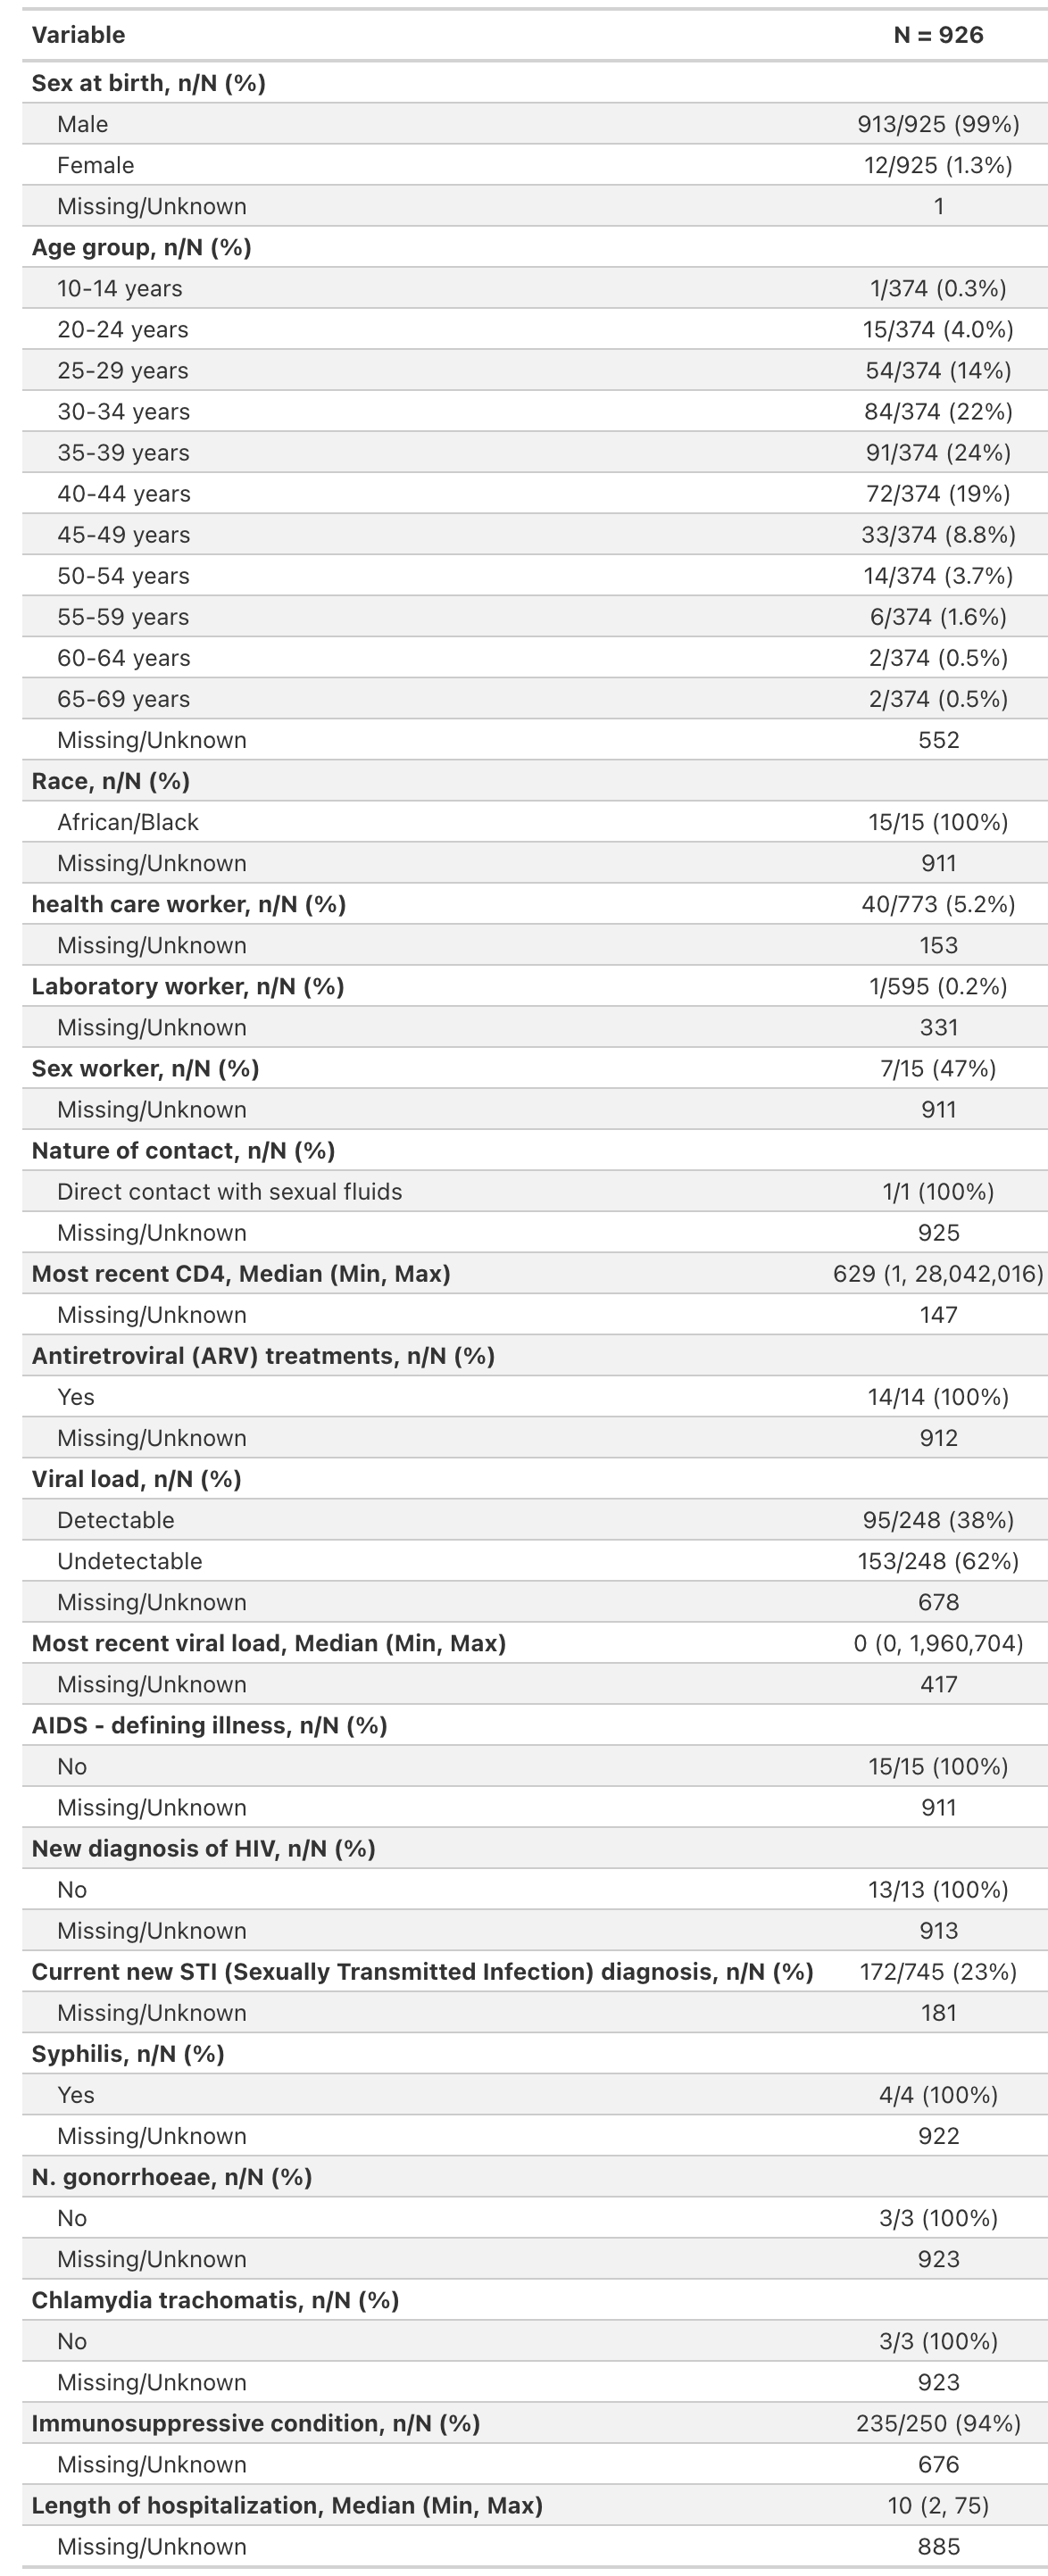
| Variable | N = 926 |
|---|---|
| Sex at birth, n/N (%) | |
| Male | 913/925 (99%) |
| Female | 12/925 (1.3%) |
| Missing/Unknown | 1 |
| Age group, n/N (%) | |
| 10-14 years | 1/374 (0.3%) |
| 20-24 years | 15/374 (4.0%) |
| 25-29 years | 54/374 (14%) |
| 30-34 years | 84/374 (22%) |
| 35-39 years | 91/374 (24%) |
| 40-44 years | 72/374 (19%) |
| 45-49 years | 33/374 (8.8%) |
| 50-54 years | 14/374 (3.7%) |
| 55-59 years | 6/374 (1.6%) |
| 60-64 years | 2/374 (0.5%) |
| 65-69 years | 2/374 (0.5%) |
| Missing/Unknown | 552 |
| Race, n/N (%) | |
| African/Black | 15/15 (100%) |
| Missing/Unknown | 911 |
| health care worker, n/N (%) | 40/773 (5.2%) |
| Missing/Unknown | 153 |
| Laboratory worker, n/N (%) | 1/595 (0.2%) |
| Missing/Unknown | 331 |
| Sex worker, n/N (%) | 7/15 (47%) |
| Missing/Unknown | 911 |
| Nature of contact, n/N (%) | |
| Direct contact with sexual fluids | 1/1 (100%) |
| Missing/Unknown | 925 |
| Most recent CD4, Median (Min, Max) | 629 (1, 28,042,016) |
| Missing/Unknown | 147 |
| Antiretroviral (ARV) treatments, n/N (%) | |
| Yes | 14/14 (100%) |
| Missing/Unknown | 912 |
| Viral load, n/N (%) | |
| Detectable | 95/248 (38%) |
| Undetectable | 153/248 (62%) |
| Missing/Unknown | 678 |
| Most recent viral load, Median (Min, Max) | 0 (0, 1,960,704) |
| Missing/Unknown | 417 |
| AIDS - defining illness, n/N (%) | |
| No | 15/15 (100%) |
| Missing/Unknown | 911 |
| New diagnosis of HIV, n/N (%) | |
| No | 13/13 (100%) |
| Missing/Unknown | 913 |
| Current new STI (Sexually Transmitted Infection) diagnosis, n/N (%) | 172/745 (23%) |
| Missing/Unknown | 181 |
| Syphilis, n/N (%) | |
| Yes | 4/4 (100%) |
| Missing/Unknown | 922 |
| N. gonorrhoeae, n/N (%) | |
| No | 3/3 (100%) |
| Missing/Unknown | 923 |
| Chlamydia trachomatis, n/N (%) | |
| No | 3/3 (100%) |
| Missing/Unknown | 923 |
| Immunosuppressive condition, n/N (%) | 235/250 (94%) |
| Missing/Unknown | 676 |
| Length of hospitalization, Median (Min, Max) | 10 (2, 75) |
| Missing/Unknown | 885 |
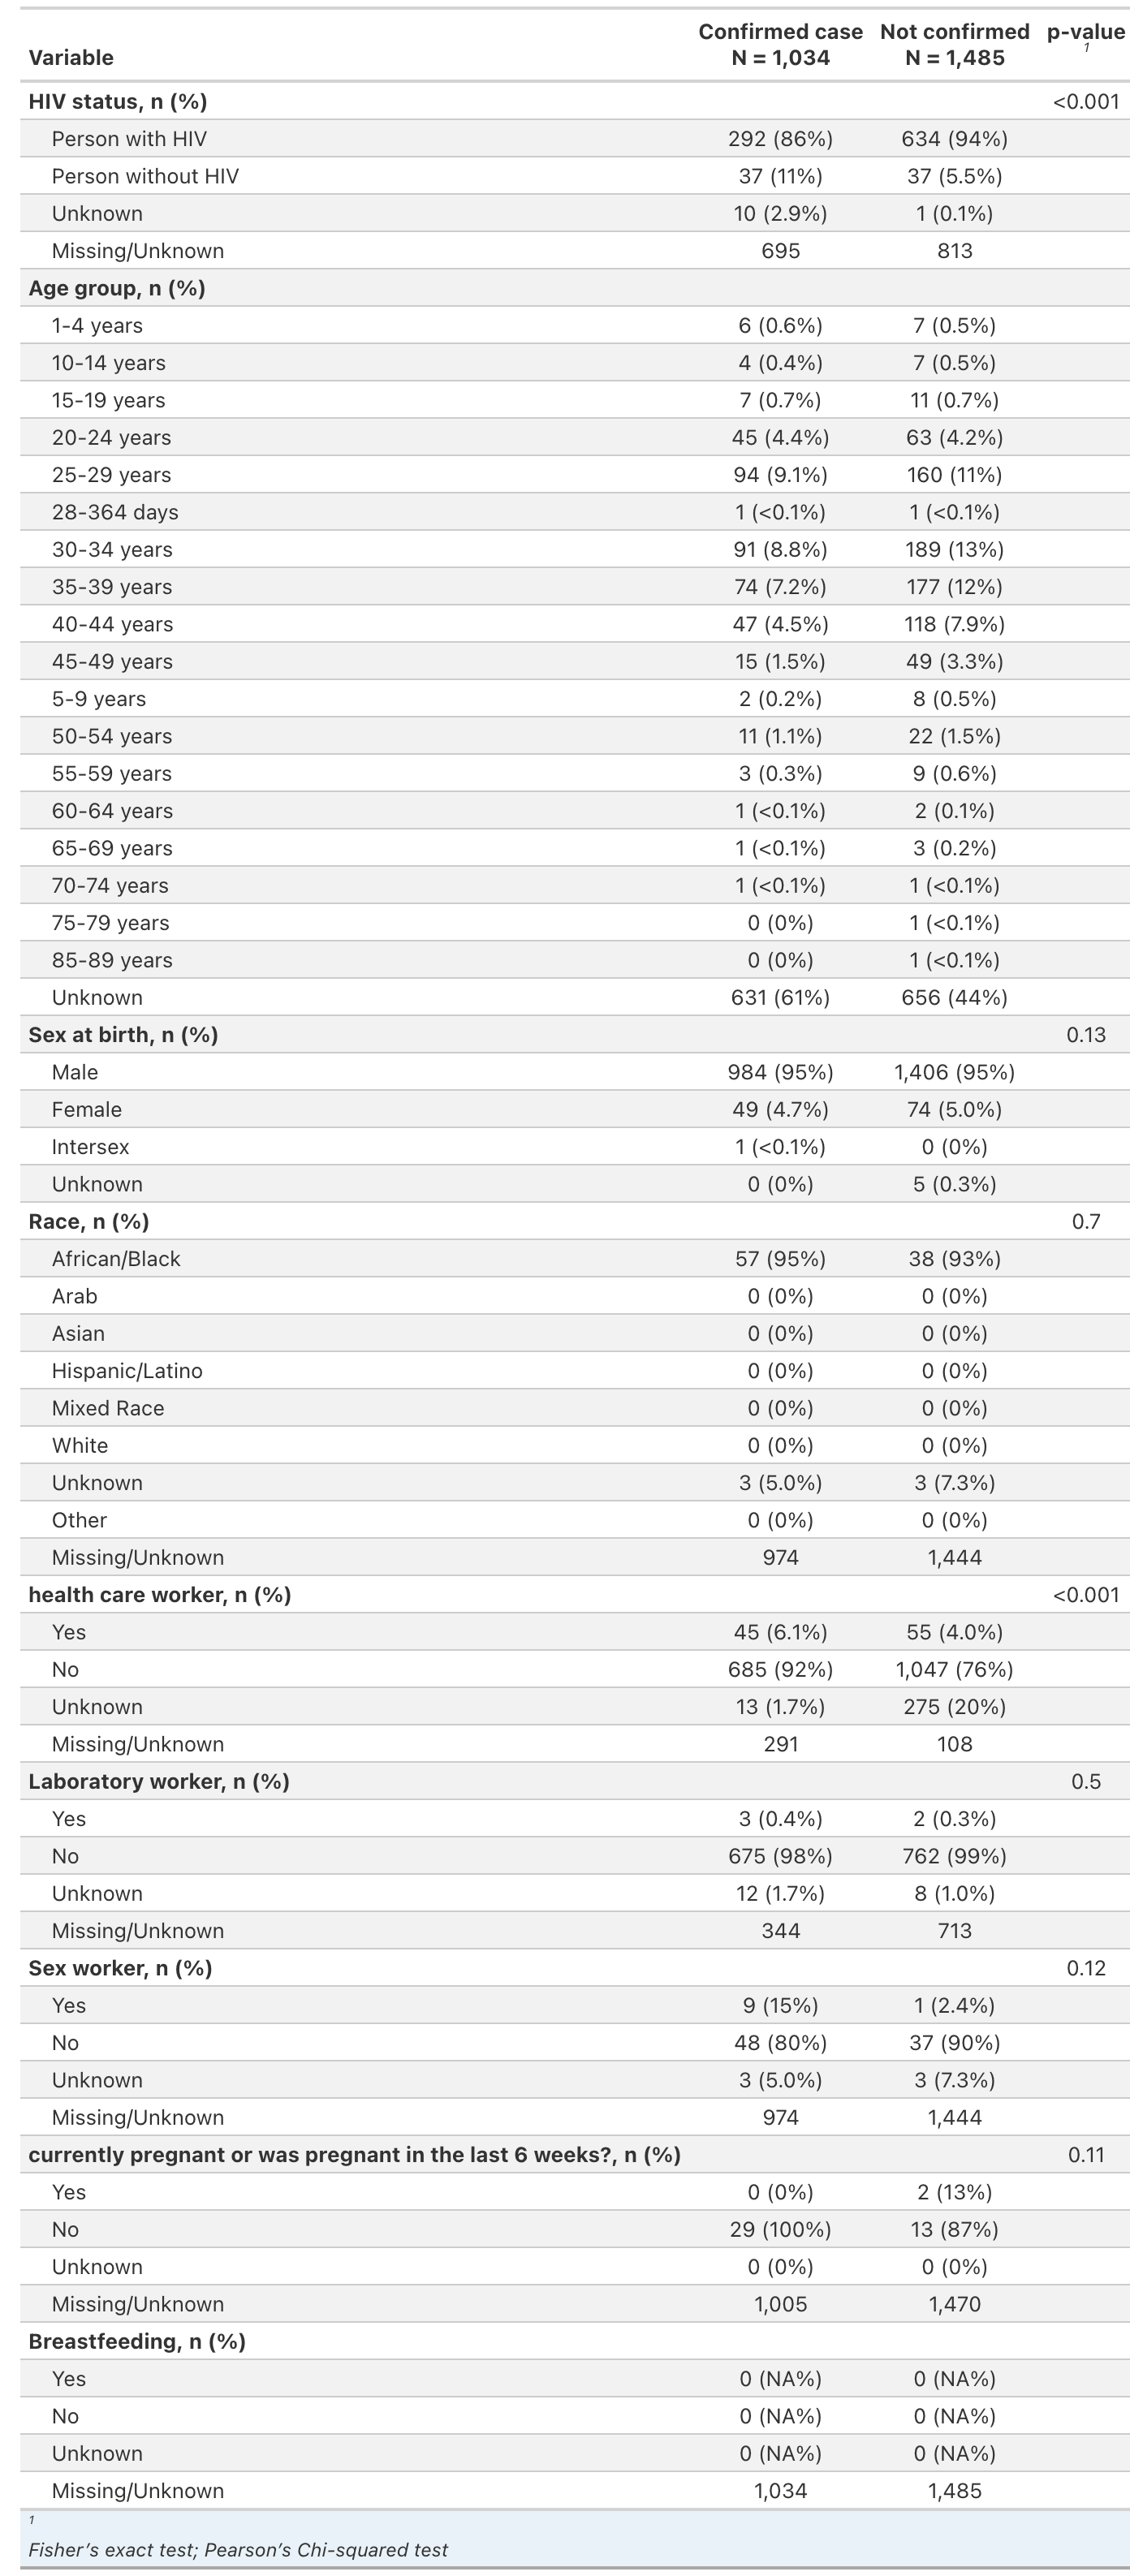
| Variable | Confirmed case |
Not confirmed |
p-value 1 |
|---|---|---|---|
| HIV status, n (%) | <0.001 | ||
| Person with HIV | 292 (86%) | 634 (94%) | |
| Person without HIV | 37 (11%) | 37 (5.5%) | |
| Unknown | 10 (2.9%) | 1 (0.1%) | |
| Missing/Unknown | 695 | 813 | |
| Age group, n (%) | |||
| 1-4 years | 6 (0.6%) | 7 (0.5%) | |
| 10-14 years | 4 (0.4%) | 7 (0.5%) | |
| 15-19 years | 7 (0.7%) | 11 (0.7%) | |
| 20-24 years | 45 (4.4%) | 63 (4.2%) | |
| 25-29 years | 94 (9.1%) | 160 (11%) | |
| 28-364 days | 1 (<0.1%) | 1 (<0.1%) | |
| 30-34 years | 91 (8.8%) | 189 (13%) | |
| 35-39 years | 74 (7.2%) | 177 (12%) | |
| 40-44 years | 47 (4.5%) | 118 (7.9%) | |
| 45-49 years | 15 (1.5%) | 49 (3.3%) | |
| 5-9 years | 2 (0.2%) | 8 (0.5%) | |
| 50-54 years | 11 (1.1%) | 22 (1.5%) | |
| 55-59 years | 3 (0.3%) | 9 (0.6%) | |
| 60-64 years | 1 (<0.1%) | 2 (0.1%) | |
| 65-69 years | 1 (<0.1%) | 3 (0.2%) | |
| 70-74 years | 1 (<0.1%) | 1 (<0.1%) | |
| 75-79 years | 0 (0%) | 1 (<0.1%) | |
| 85-89 years | 0 (0%) | 1 (<0.1%) | |
| Unknown | 631 (61%) | 656 (44%) | |
| Sex at birth, n (%) | 0.13 | ||
| Male | 984 (95%) | 1,406 (95%) | |
| Female | 49 (4.7%) | 74 (5.0%) | |
| Intersex | 1 (<0.1%) | 0 (0%) | |
| Unknown | 0 (0%) | 5 (0.3%) | |
| Race, n (%) | 0.7 | ||
| African/Black | 57 (95%) | 38 (93%) | |
| Arab | 0 (0%) | 0 (0%) | |
| Asian | 0 (0%) | 0 (0%) | |
| Hispanic/Latino | 0 (0%) | 0 (0%) | |
| Mixed Race | 0 (0%) | 0 (0%) | |
| White | 0 (0%) | 0 (0%) | |
| Unknown | 3 (5.0%) | 3 (7.3%) | |
| Other | 0 (0%) | 0 (0%) | |
| Missing/Unknown | 974 | 1,444 | |
| health care worker, n (%) | <0.001 | ||
| Yes | 45 (6.1%) | 55 (4.0%) | |
| No | 685 (92%) | 1,047 (76%) | |
| Unknown | 13 (1.7%) | 275 (20%) | |
| Missing/Unknown | 291 | 108 | |
| Laboratory worker, n (%) | 0.5 | ||
| Yes | 3 (0.4%) | 2 (0.3%) | |
| No | 675 (98%) | 762 (99%) | |
| Unknown | 12 (1.7%) | 8 (1.0%) | |
| Missing/Unknown | 344 | 713 | |
| Sex worker, n (%) | 0.12 | ||
| Yes | 9 (15%) | 1 (2.4%) | |
| No | 48 (80%) | 37 (90%) | |
| Unknown | 3 (5.0%) | 3 (7.3%) | |
| Missing/Unknown | 974 | 1,444 | |
| currently pregnant or was pregnant in the last 6 weeks?, n (%) | 0.11 | ||
| Yes | 0 (0%) | 2 (13%) | |
| No | 29 (100%) | 13 (87%) | |
| Unknown | 0 (0%) | 0 (0%) | |
| Missing/Unknown | 1,005 | 1,470 | |
| Breastfeeding, n (%) | |||
| Yes | 0 (NA%) | 0 (NA%) | |
| No | 0 (NA%) | 0 (NA%) | |
| Unknown | 0 (NA%) | 0 (NA%) | |
| Missing/Unknown | 1,034 | 1,485 | |
| 1
Fisher’s exact test; Pearson’s Chi-squared test |
|||
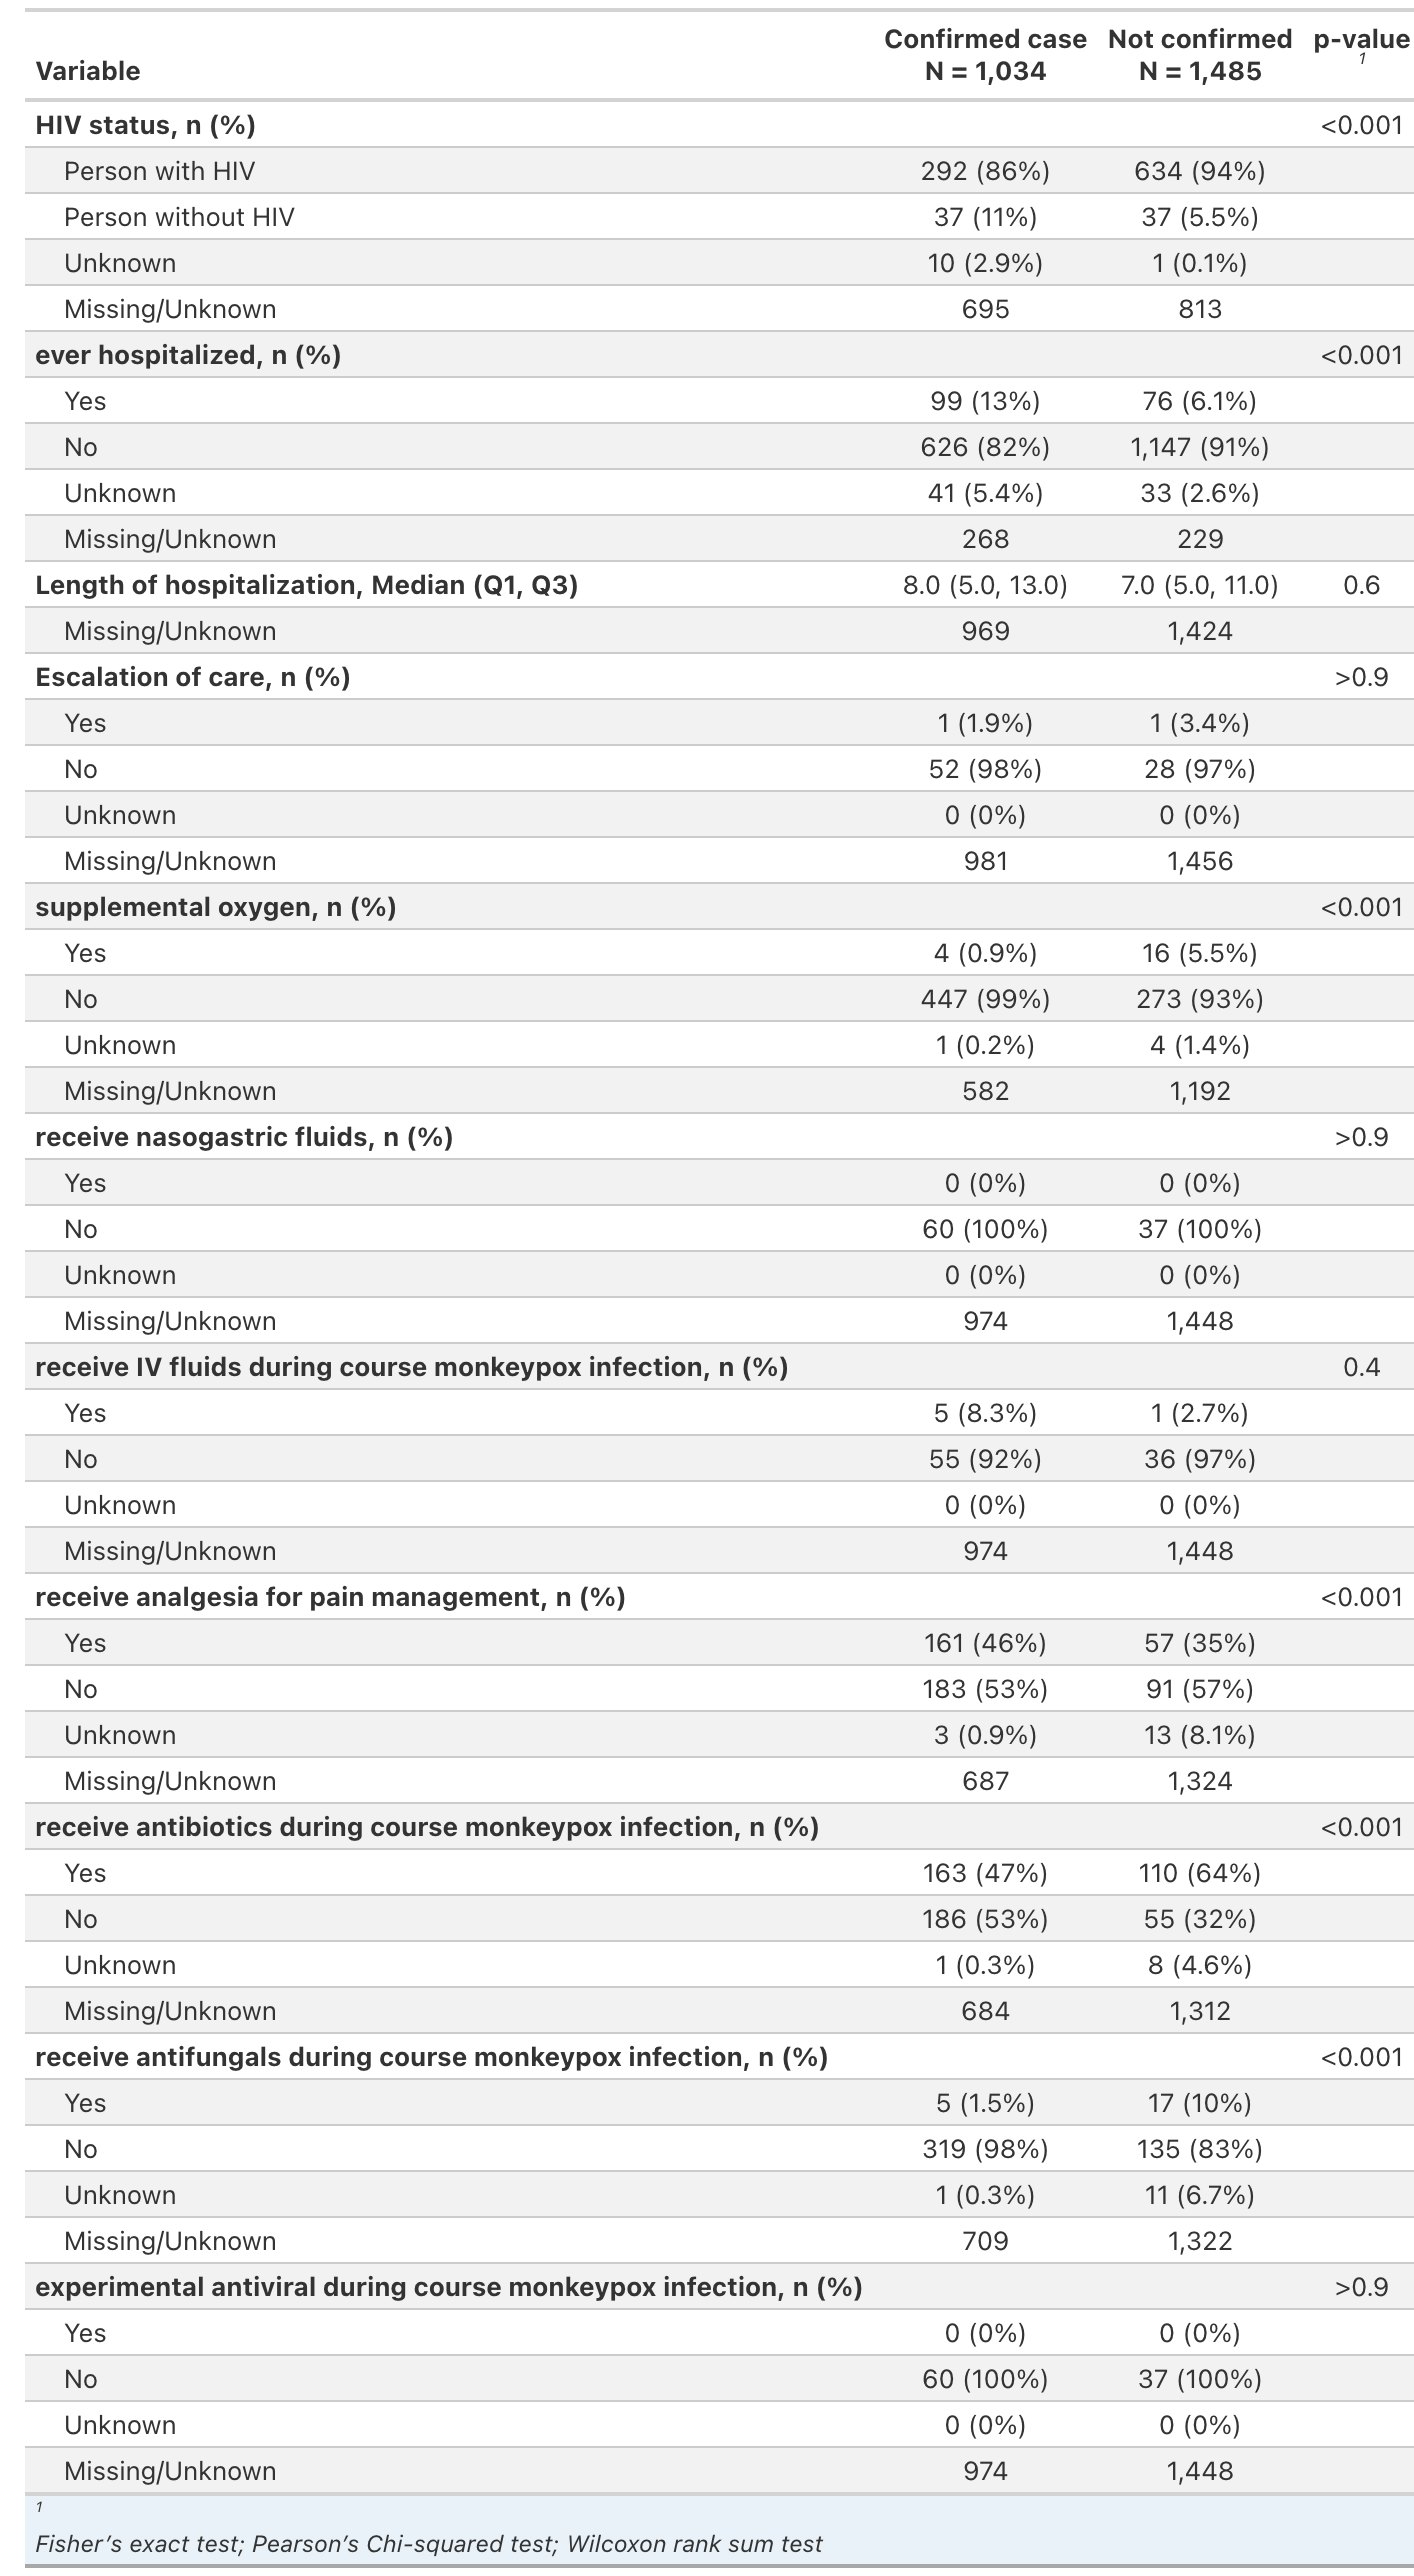
| Variable | Confirmed case |
Not confirmed |
p-value 1 |
|---|---|---|---|
| HIV status, n (%) | <0.001 | ||
| Person with HIV | 292 (86%) | 634 (94%) | |
| Person without HIV | 37 (11%) | 37 (5.5%) | |
| Unknown | 10 (2.9%) | 1 (0.1%) | |
| Missing/Unknown | 695 | 813 | |
| ever hospitalized, n (%) | <0.001 | ||
| Yes | 99 (13%) | 76 (6.1%) | |
| No | 626 (82%) | 1,147 (91%) | |
| Unknown | 41 (5.4%) | 33 (2.6%) | |
| Missing/Unknown | 268 | 229 | |
| Length of hospitalization, Median (Q1, Q3) | 8.0 (5.0, 13.0) | 7.0 (5.0, 11.0) | 0.6 |
| Missing/Unknown | 969 | 1,424 | |
| Escalation of care, n (%) | >0.9 | ||
| Yes | 1 (1.9%) | 1 (3.4%) | |
| No | 52 (98%) | 28 (97%) | |
| Unknown | 0 (0%) | 0 (0%) | |
| Missing/Unknown | 981 | 1,456 | |
| supplemental oxygen, n (%) | <0.001 | ||
| Yes | 4 (0.9%) | 16 (5.5%) | |
| No | 447 (99%) | 273 (93%) | |
| Unknown | 1 (0.2%) | 4 (1.4%) | |
| Missing/Unknown | 582 | 1,192 | |
| receive nasogastric fluids, n (%) | >0.9 | ||
| Yes | 0 (0%) | 0 (0%) | |
| No | 60 (100%) | 37 (100%) | |
| Unknown | 0 (0%) | 0 (0%) | |
| Missing/Unknown | 974 | 1,448 | |
| receive IV fluids during course monkeypox infection, n (%) | 0.4 | ||
| Yes | 5 (8.3%) | 1 (2.7%) | |
| No | 55 (92%) | 36 (97%) | |
| Unknown | 0 (0%) | 0 (0%) | |
| Missing/Unknown | 974 | 1,448 | |
| receive analgesia for pain management, n (%) | <0.001 | ||
| Yes | 161 (46%) | 57 (35%) | |
| No | 183 (53%) | 91 (57%) | |
| Unknown | 3 (0.9%) | 13 (8.1%) | |
| Missing/Unknown | 687 | 1,324 | |
| receive antibiotics during course monkeypox infection, n (%) | <0.001 | ||
| Yes | 163 (47%) | 110 (64%) | |
| No | 186 (53%) | 55 (32%) | |
| Unknown | 1 (0.3%) | 8 (4.6%) | |
| Missing/Unknown | 684 | 1,312 | |
| receive antifungals during course monkeypox infection, n (%) | <0.001 | ||
| Yes | 5 (1.5%) | 17 (10%) | |
| No | 319 (98%) | 135 (83%) | |
| Unknown | 1 (0.3%) | 11 (6.7%) | |
| Missing/Unknown | 709 | 1,322 | |
| experimental antiviral during course monkeypox infection, n (%) | >0.9 | ||
| Yes | 0 (0%) | 0 (0%) | |
| No | 60 (100%) | 37 (100%) | |
| Unknown | 0 (0%) | 0 (0%) | |
| Missing/Unknown | 974 | 1,448 | |
| 1
Fisher’s exact test; Pearson’s Chi-squared test; Wilcoxon rank sum test |
|||
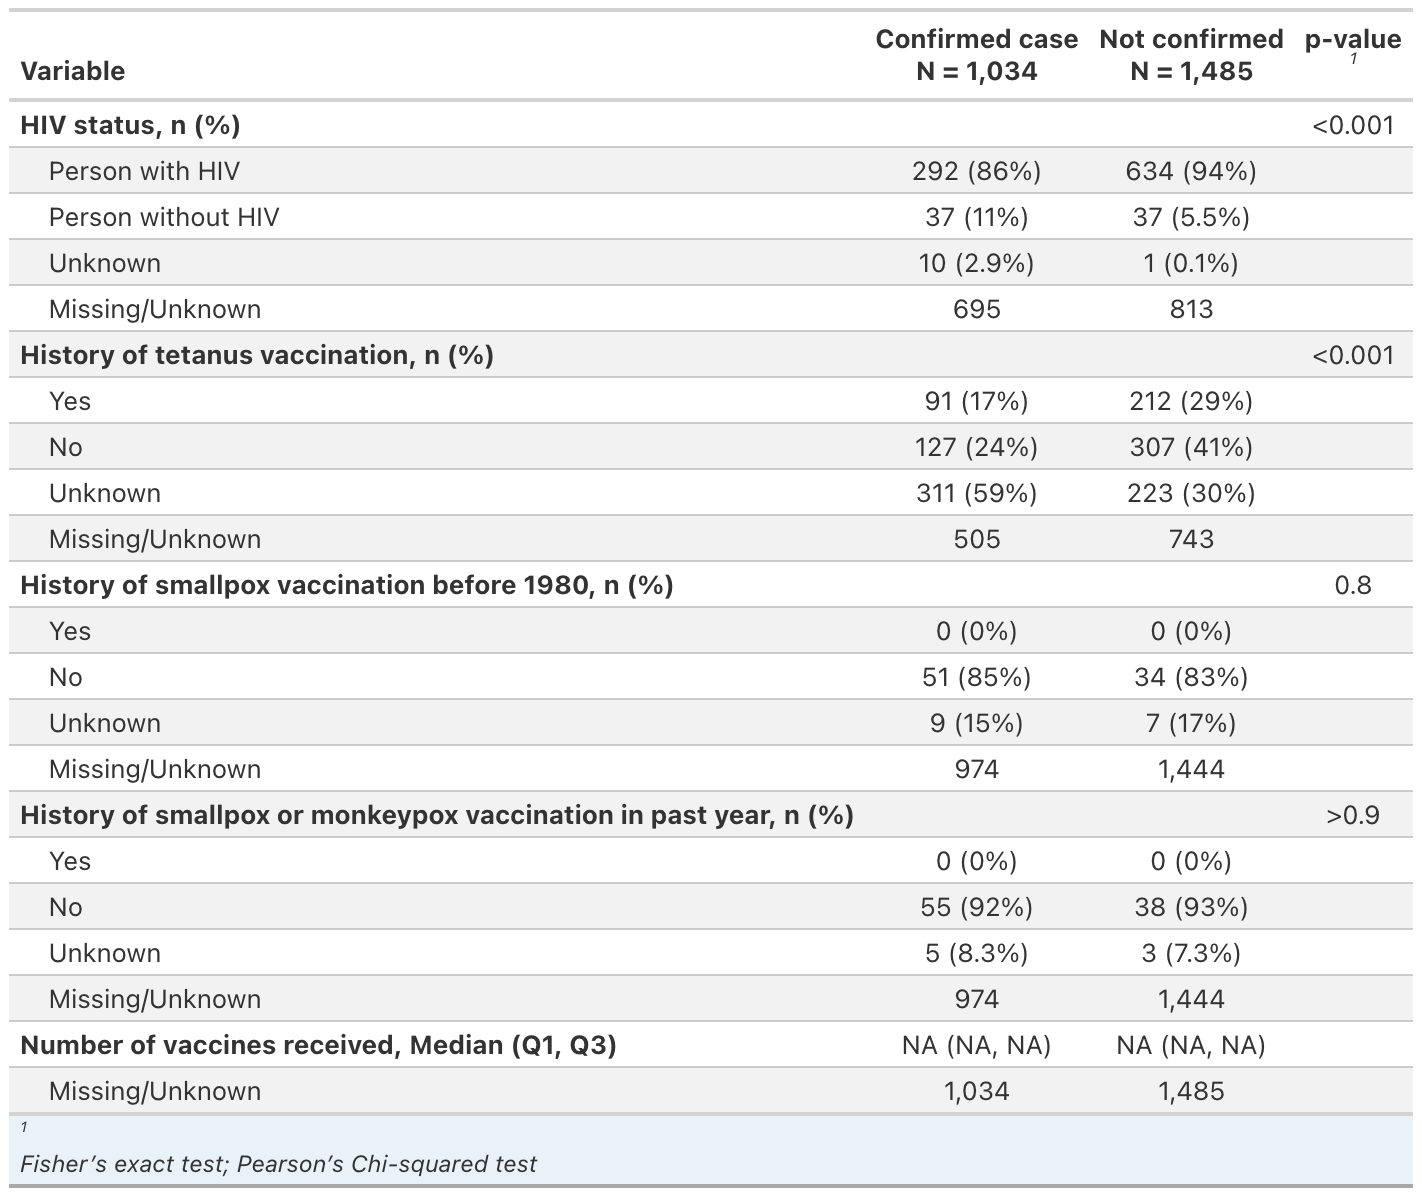
| Variable | Confirmed case |
Not confirmed |
p-value 1 |
|---|---|---|---|
| HIV status, n (%) | <0.001 | ||
| Person with HIV | 292 (86%) | 634 (94%) | |
| Person without HIV | 37 (11%) | 37 (5.5%) | |
| Unknown | 10 (2.9%) | 1 (0.1%) | |
| Missing/Unknown | 695 | 813 | |
| History of tetanus vaccination, n (%) | <0.001 | ||
| Yes | 91 (17%) | 212 (29%) | |
| No | 127 (24%) | 307 (41%) | |
| Unknown | 311 (59%) | 223 (30%) | |
| Missing/Unknown | 505 | 743 | |
| History of smallpox vaccination before 1980, n (%) | 0.8 | ||
| Yes | 0 (0%) | 0 (0%) | |
| No | 51 (85%) | 34 (83%) | |
| Unknown | 9 (15%) | 7 (17%) | |
| Missing/Unknown | 974 | 1,444 | |
| History of smallpox or monkeypox vaccination in past year, n (%) | >0.9 | ||
| Yes | 0 (0%) | 0 (0%) | |
| No | 55 (92%) | 38 (93%) | |
| Unknown | 5 (8.3%) | 3 (7.3%) | |
| Missing/Unknown | 974 | 1,444 | |
| Number of vaccines received, Median (Q1, Q3) | NA (NA, NA) | NA (NA, NA) | |
| Missing/Unknown | 1,034 | 1,485 | |
| 1
Fisher’s exact test; Pearson’s Chi-squared test |
|||
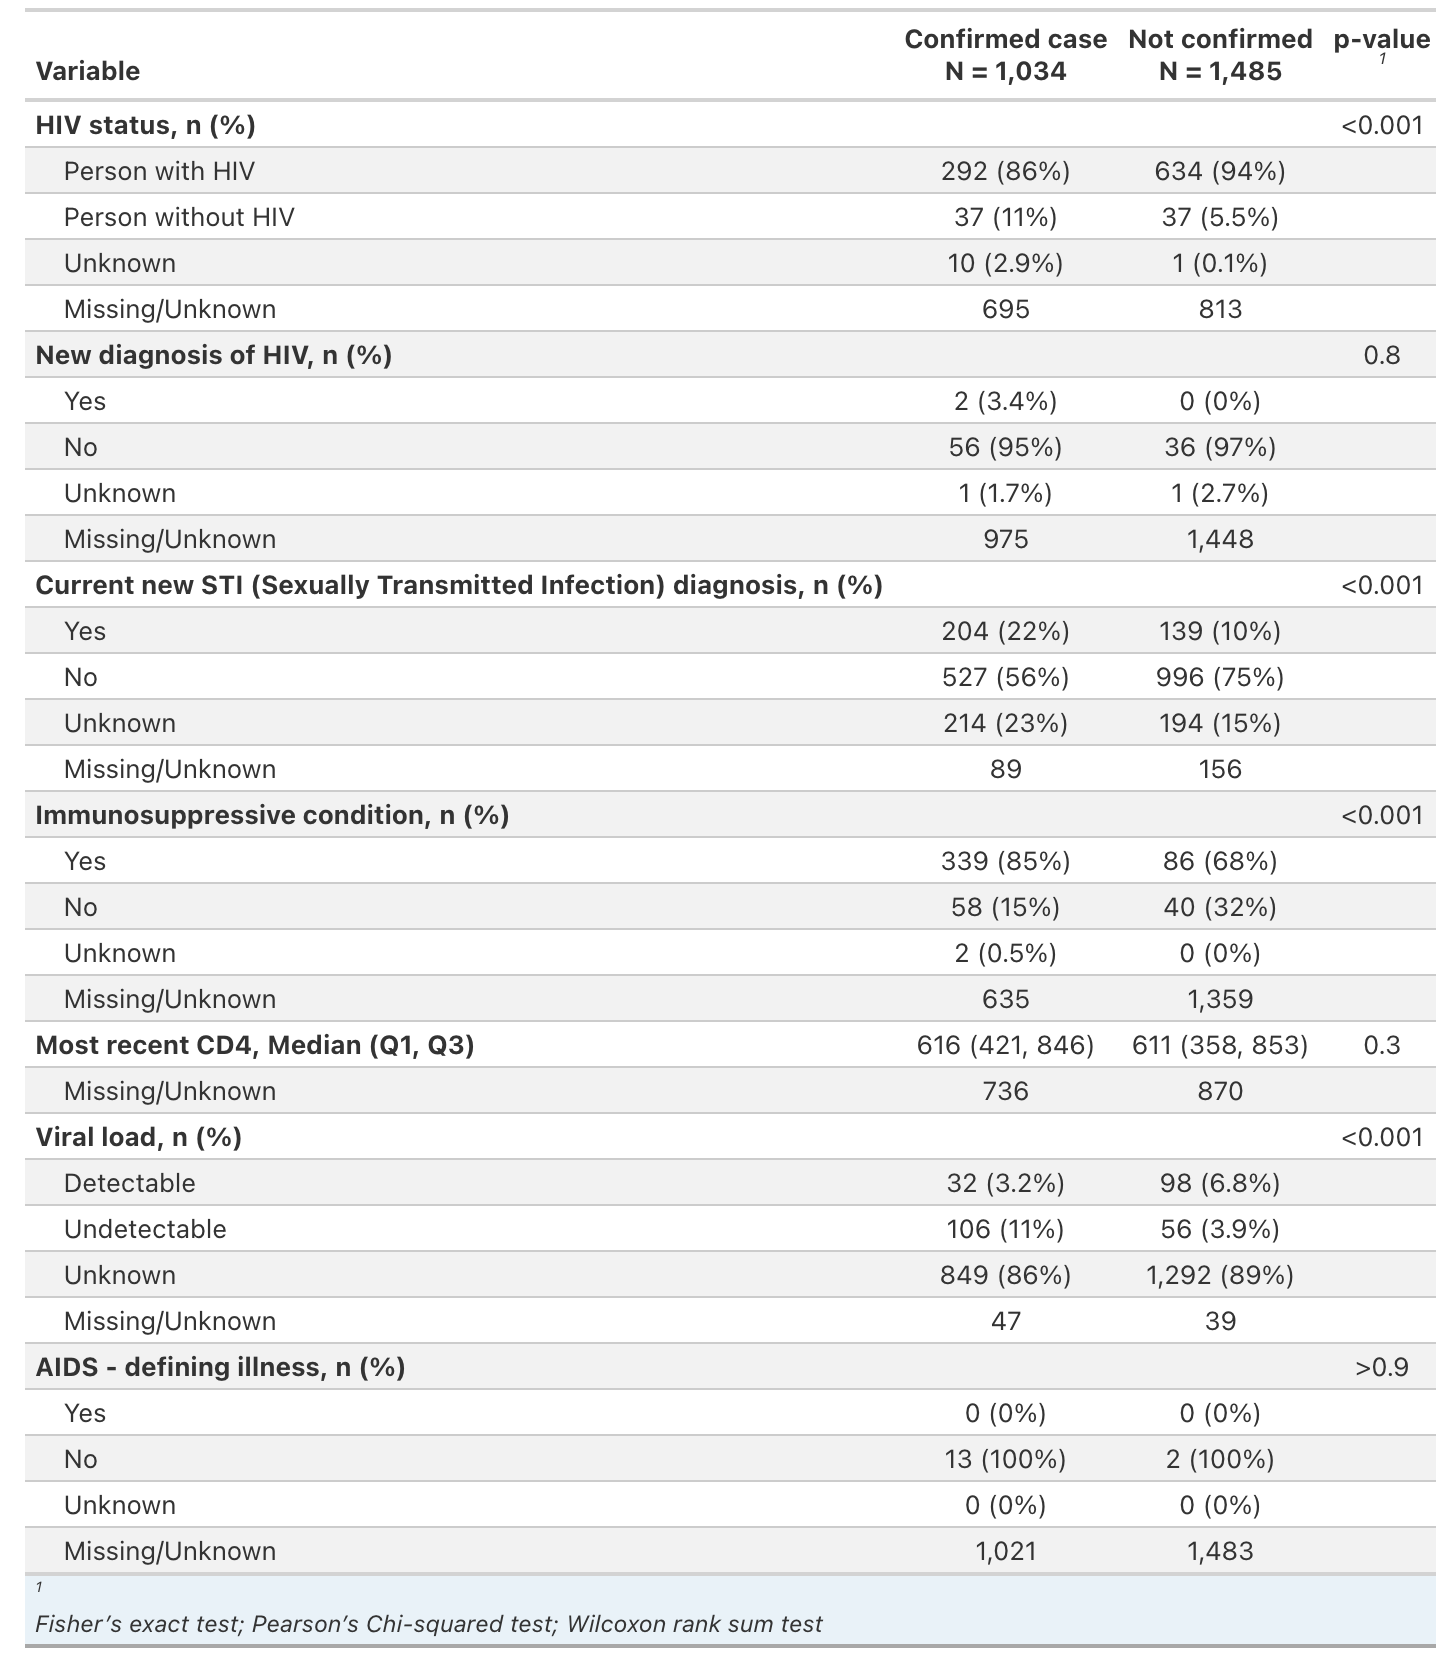
| Variable | Confirmed case |
Not confirmed |
p-value 1 |
|---|---|---|---|
| HIV status, n (%) | <0.001 | ||
| Person with HIV | 292 (86%) | 634 (94%) | |
| Person without HIV | 37 (11%) | 37 (5.5%) | |
| Unknown | 10 (2.9%) | 1 (0.1%) | |
| Missing/Unknown | 695 | 813 | |
| New diagnosis of HIV, n (%) | 0.8 | ||
| Yes | 2 (3.4%) | 0 (0%) | |
| No | 56 (95%) | 36 (97%) | |
| Unknown | 1 (1.7%) | 1 (2.7%) | |
| Missing/Unknown | 975 | 1,448 | |
| Current new STI (Sexually Transmitted Infection) diagnosis, n (%) | <0.001 | ||
| Yes | 204 (22%) | 139 (10%) | |
| No | 527 (56%) | 996 (75%) | |
| Unknown | 214 (23%) | 194 (15%) | |
| Missing/Unknown | 89 | 156 | |
| Immunosuppressive condition, n (%) | <0.001 | ||
| Yes | 339 (85%) | 86 (68%) | |
| No | 58 (15%) | 40 (32%) | |
| Unknown | 2 (0.5%) | 0 (0%) | |
| Missing/Unknown | 635 | 1,359 | |
| Most recent CD4, Median (Q1, Q3) | 616 (421, 846) | 611 (358, 853) | 0.3 |
| Missing/Unknown | 736 | 870 | |
| Viral load, n (%) | <0.001 | ||
| Detectable | 32 (3.2%) | 98 (6.8%) | |
| Undetectable | 106 (11%) | 56 (3.9%) | |
| Unknown | 849 (86%) | 1,292 (89%) | |
| Missing/Unknown | 47 | 39 | |
| AIDS - defining illness, n (%) | >0.9 | ||
| Yes | 0 (0%) | 0 (0%) | |
| No | 13 (100%) | 2 (100%) | |
| Unknown | 0 (0%) | 0 (0%) | |
| Missing/Unknown | 1,021 | 1,483 | |
| 1
Fisher’s exact test; Pearson’s Chi-squared test; Wilcoxon rank sum test |
|||
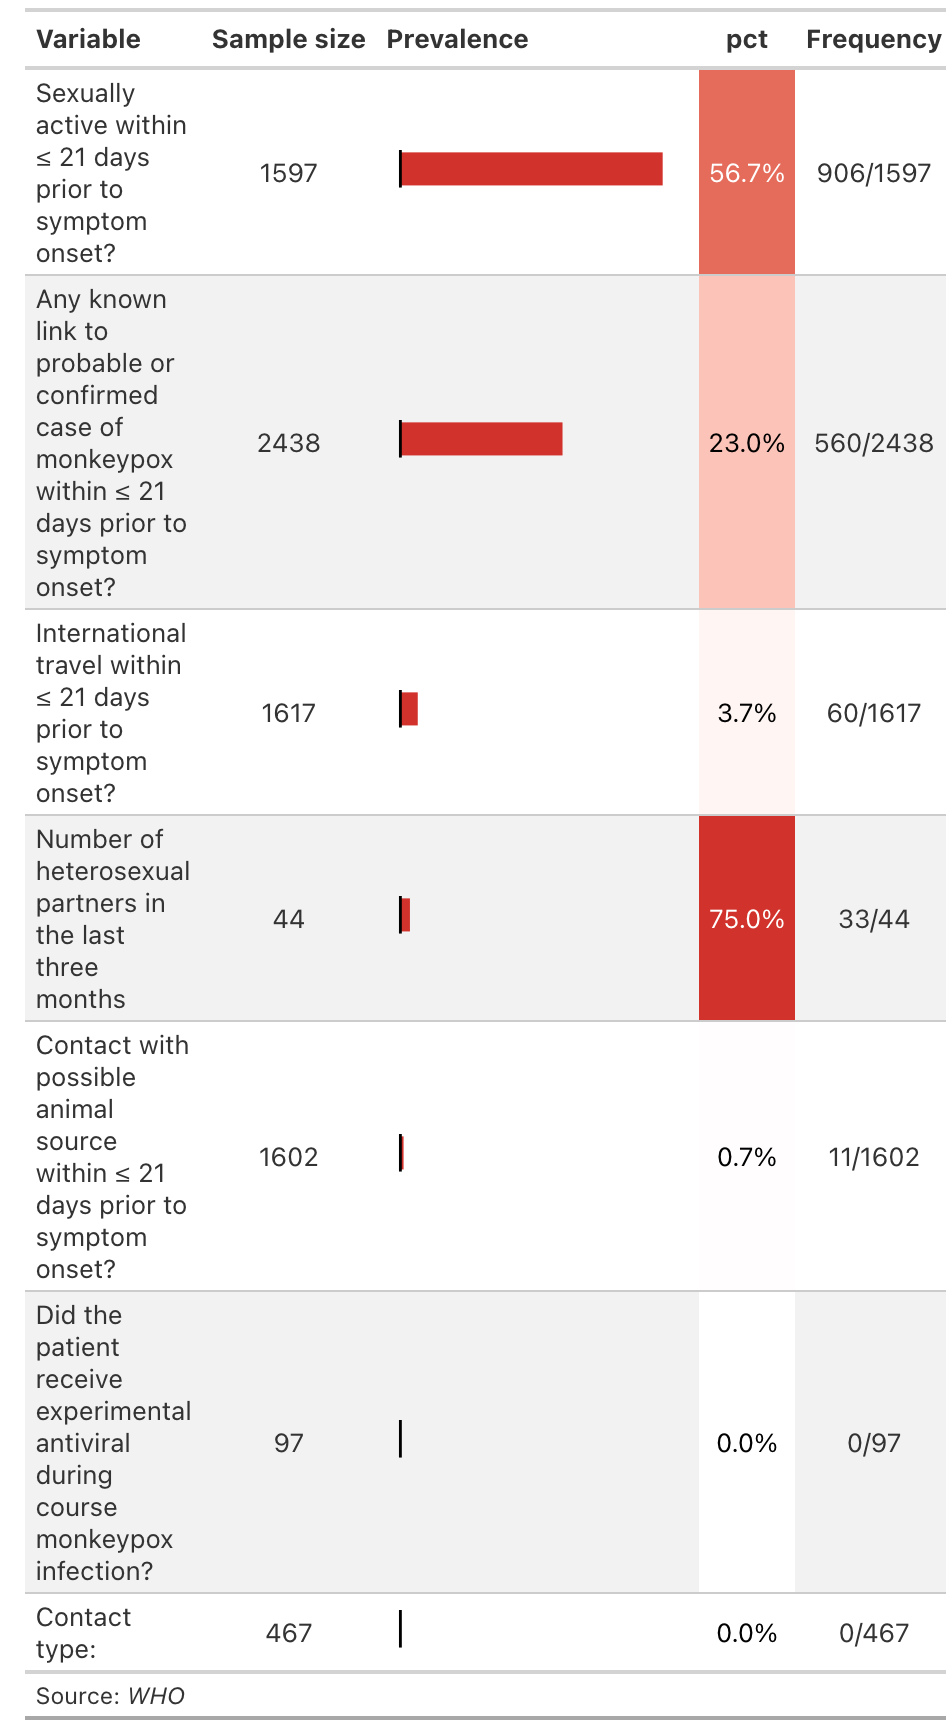
| Variable | Sample size | Prevalence | pct | Frequency |
|---|---|---|---|---|
| Sexually active within ≤ 21 days prior to symptom onset? | 1597 | 56.7% | 906/1597 | |
| Any known link to probable or confirmed case of monkeypox within ≤ 21 days prior to symptom onset? | 2438 | 23.0% | 560/2438 | |
| International travel within ≤ 21 days prior to symptom onset? | 1617 | 3.7% | 60/1617 | |
| Number of heterosexual partners in the last three months | 44 | 75.0% | 33/44 | |
| Contact with possible animal source within ≤ 21 days prior to symptom onset? | 1602 | 0.7% | 11/1602 | |
| Did the patient receive experimental antiviral during course monkeypox infection? | 97 | 0.0% | 0/97 | |
| Contact type: | 467 | 0.0% | 0/467 | |
Source: WHO |
||||
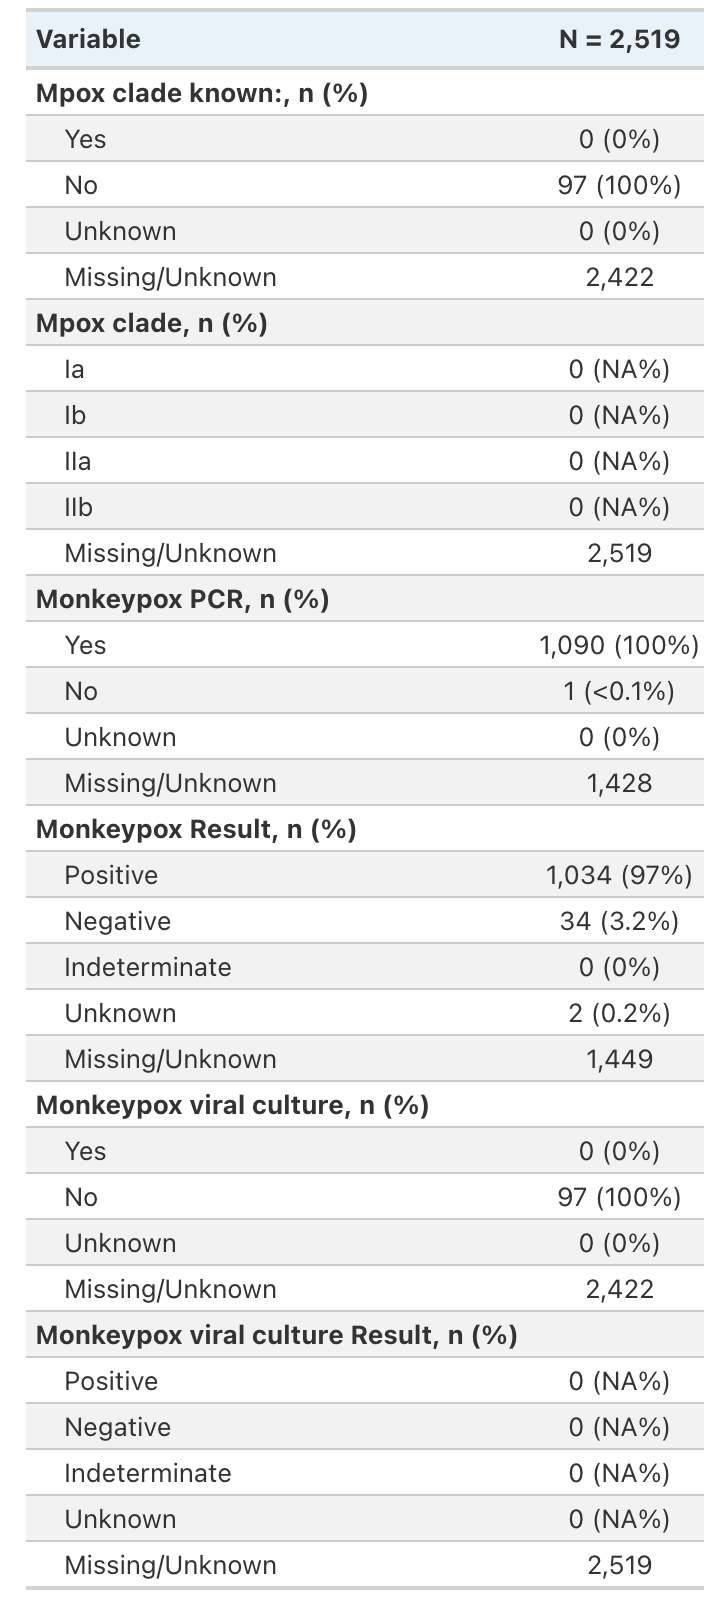
| Variable | N = 2,519 |
|---|---|
| Mpox clade known:, n (%) | |
| Yes | 0 (0%) |
| No | 97 (100%) |
| Unknown | 0 (0%) |
| Missing/Unknown | 2,422 |
| Mpox clade, n (%) | |
| Ia | 0 (NA%) |
| Ib | 0 (NA%) |
| IIa | 0 (NA%) |
| IIb | 0 (NA%) |
| Missing/Unknown | 2,519 |
| Monkeypox PCR, n (%) | |
| Yes | 1,090 (100%) |
| No | 1 (<0.1%) |
| Unknown | 0 (0%) |
| Missing/Unknown | 1,428 |
| Monkeypox Result, n (%) | |
| Positive | 1,034 (97%) |
| Negative | 34 (3.2%) |
| Indeterminate | 0 (0%) |
| Unknown | 2 (0.2%) |
| Missing/Unknown | 1,449 |
| Monkeypox viral culture, n (%) | |
| Yes | 0 (0%) |
| No | 97 (100%) |
| Unknown | 0 (0%) |
| Missing/Unknown | 2,422 |
| Monkeypox viral culture Result, n (%) | |
| Positive | 0 (NA%) |
| Negative | 0 (NA%) |
| Indeterminate | 0 (NA%) |
| Unknown | 0 (NA%) |
| Missing/Unknown | 2,519 |
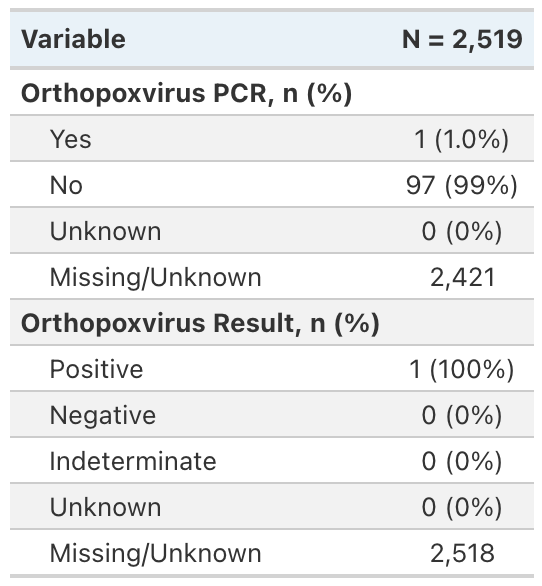
| Variable | N = 2,519 |
|---|---|
| Orthopoxvirus PCR, n (%) | |
| Yes | 1 (1.0%) |
| No | 97 (99%) |
| Unknown | 0 (0%) |
| Missing/Unknown | 2,421 |
| Orthopoxvirus Result, n (%) | |
| Positive | 1 (100%) |
| Negative | 0 (0%) |
| Indeterminate | 0 (0%) |
| Unknown | 0 (0%) |
| Missing/Unknown | 2,518 |
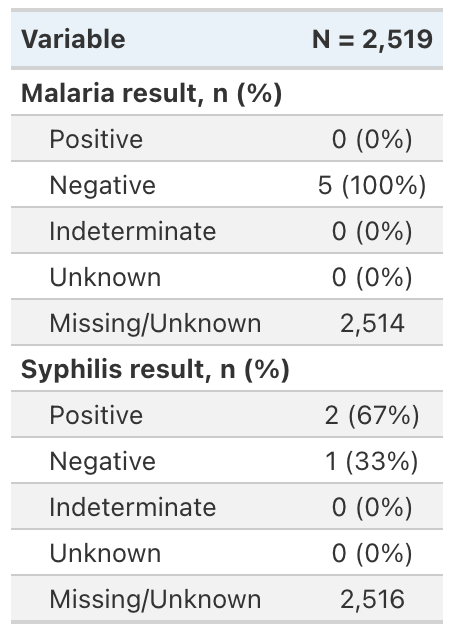
| Variable | N = 2,519 |
|---|---|
| Malaria result, n (%) | |
| Positive | 0 (0%) |
| Negative | 5 (100%) |
| Indeterminate | 0 (0%) |
| Unknown | 0 (0%) |
| Missing/Unknown | 2,514 |
| Syphilis result, n (%) | |
| Positive | 2 (67%) |
| Negative | 1 (33%) |
| Indeterminate | 0 (0%) |
| Unknown | 0 (0%) |
| Missing/Unknown | 2,516 |
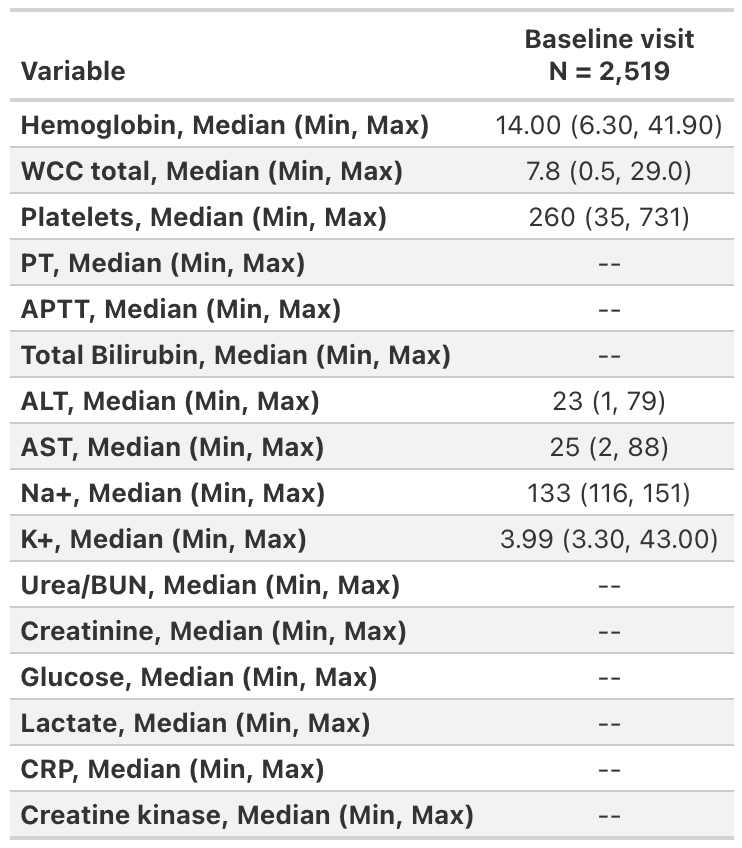
| Variable | Baseline visit |
|---|---|
| Hemoglobin, Median (Min, Max) | 14.00 (6.30, 41.90) |
| WCC total, Median (Min, Max) | 7.8 (0.5, 29.0) |
| Platelets, Median (Min, Max) | 260 (35, 731) |
| PT, Median (Min, Max) | -- |
| APTT, Median (Min, Max) | -- |
| Total Bilirubin, Median (Min, Max) | -- |
| ALT, Median (Min, Max) | 23 (1, 79) |
| AST, Median (Min, Max) | 25 (2, 88) |
| Na+, Median (Min, Max) | 133 (116, 151) |
| K+, Median (Min, Max) | 3.99 (3.30, 43.00) |
| Urea/BUN, Median (Min, Max) | -- |
| Creatinine, Median (Min, Max) | -- |
| Glucose, Median (Min, Max) | -- |
| Lactate, Median (Min, Max) | -- |
| CRP, Median (Min, Max) | -- |
| Creatine kinase, Median (Min, Max) | -- |
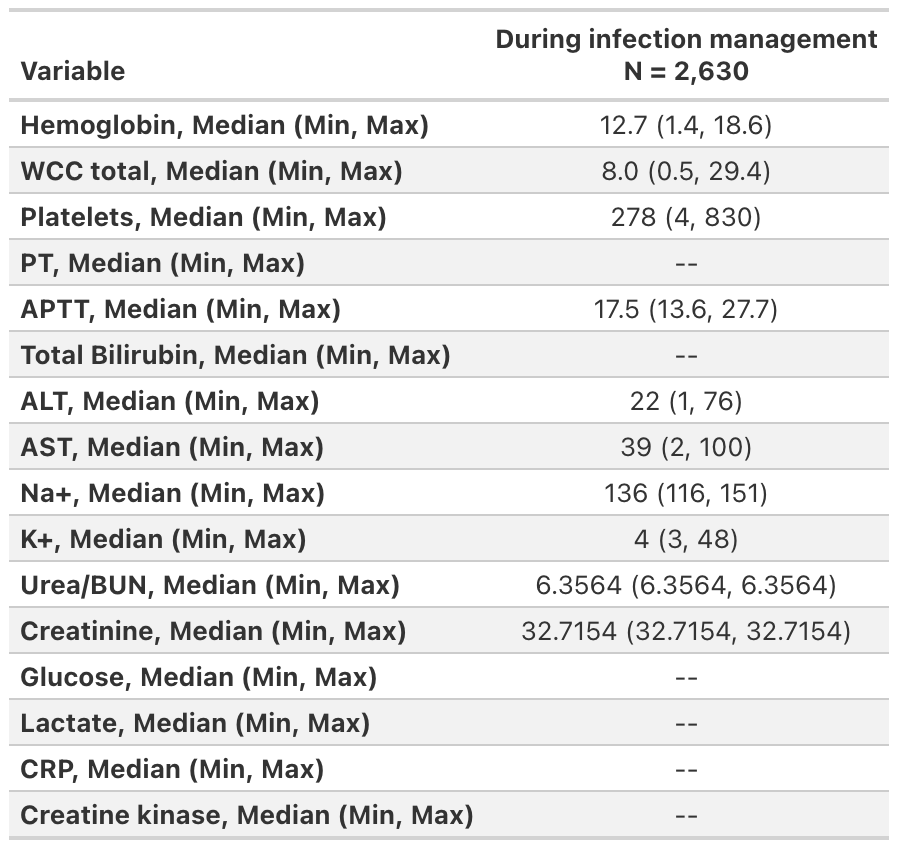
| Variable | During infection management |
|---|---|
| Hemoglobin, Median (Min, Max) | 12.7 (1.4, 18.6) |
| WCC total, Median (Min, Max) | 8.0 (0.5, 29.4) |
| Platelets, Median (Min, Max) | 278 (4, 830) |
| PT, Median (Min, Max) | -- |
| APTT, Median (Min, Max) | 17.5 (13.6, 27.7) |
| Total Bilirubin, Median (Min, Max) | -- |
| ALT, Median (Min, Max) | 22 (1, 76) |
| AST, Median (Min, Max) | 39 (2, 100) |
| Na+, Median (Min, Max) | 136 (116, 151) |
| K+, Median (Min, Max) | 4 (3, 48) |
| Urea/BUN, Median (Min, Max) | 6.3564 (6.3564, 6.3564) |
| Creatinine, Median (Min, Max) | 32.7154 (32.7154, 32.7154) |
| Glucose, Median (Min, Max) | -- |
| Lactate, Median (Min, Max) | -- |
| CRP, Median (Min, Max) | -- |
| Creatine kinase, Median (Min, Max) | -- |
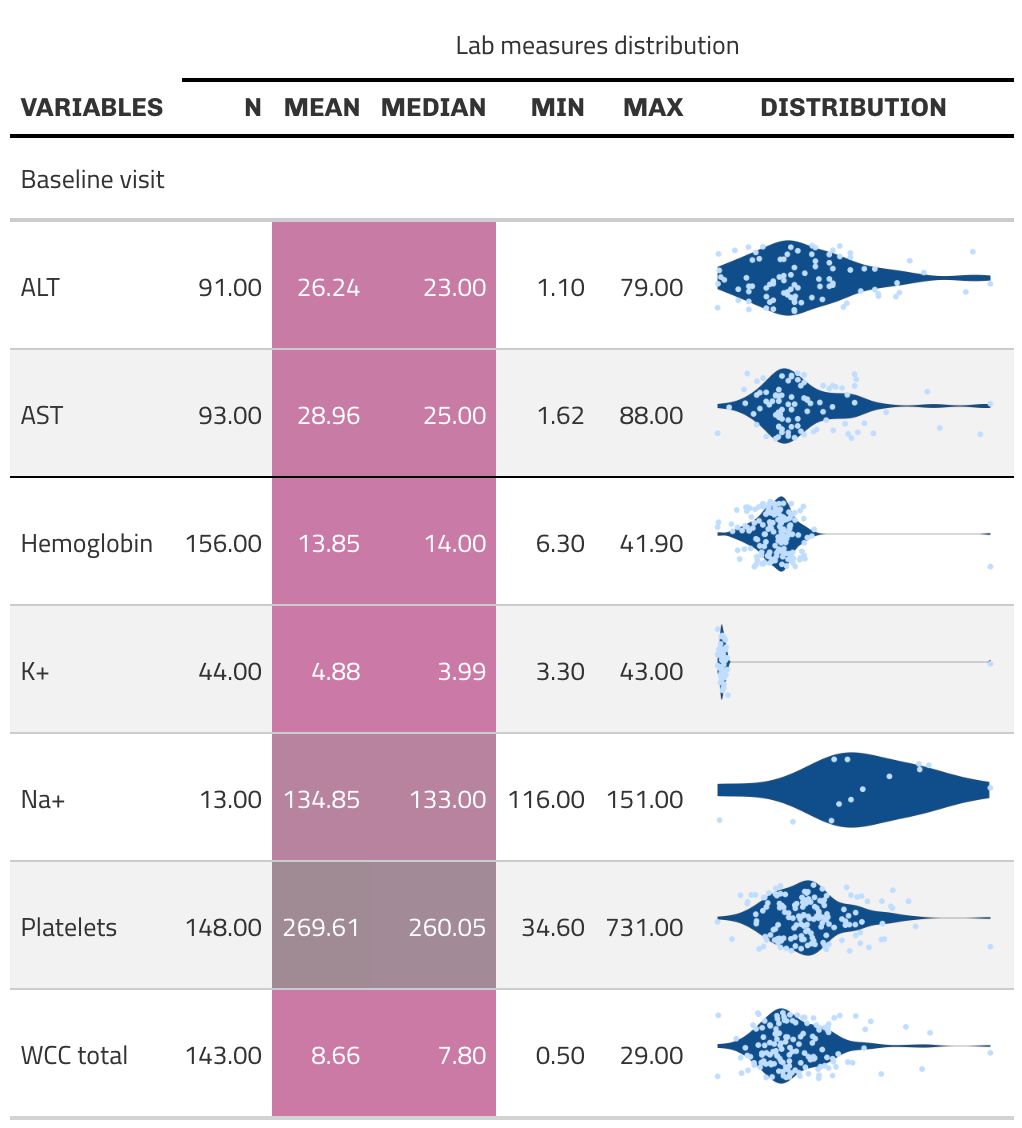
| Variables | Lab measures distribution | |||||
|---|---|---|---|---|---|---|
| N | Mean | Median | Min | Max | Distribution | |
| Baseline visit | ||||||
| ALT | 91.00 | 26.24 | 23.00 | 1.10 | 79.00 |  |
| AST | 93.00 | 28.96 | 25.00 | 1.62 | 88.00 |  |
| Hemoglobin | 156.00 | 13.85 | 14.00 | 6.30 | 41.90 |  |
| K+ | 44.00 | 4.88 | 3.99 | 3.30 | 43.00 |  |
| Na+ | 13.00 | 134.85 | 133.00 | 116.00 | 151.00 |  |
| Platelets | 148.00 | 269.61 | 260.05 | 34.60 | 731.00 |  |
| WCC total | 143.00 | 8.66 | 7.80 | 0.50 | 29.00 |  |